flowchart LR
  A[1] --> B(2)
  B --> C{3}
  C --> D[4]
  C --> E[5]
Documents
Divs
Multiple columns
report.qmd
::: {layout-ncol=2}

Photo by <a href="https://unsplash.com/@_louisreed?utm_source=unsplash&utm_medium=referral&utm_content=creditCopyText">Louis Reed</a> on <a href="https://unsplash.com/photos/refill-of-liquid-on-tubes-pwcKF7L4-no?utm_source=unsplash&utm_medium=referral&utm_content=creditCopyText">Unsplash</a>
:::
Photo by Louis Reed on Unsplash
Spans
This is text that is red.
Changing formats

Changing formats
report.qmd

Changing formats

Editing slides
The quarto-revealjs-editable extension allows for the repositioning and resizing of images and text divs directly in previewed slides.
Custom Revealjs formats


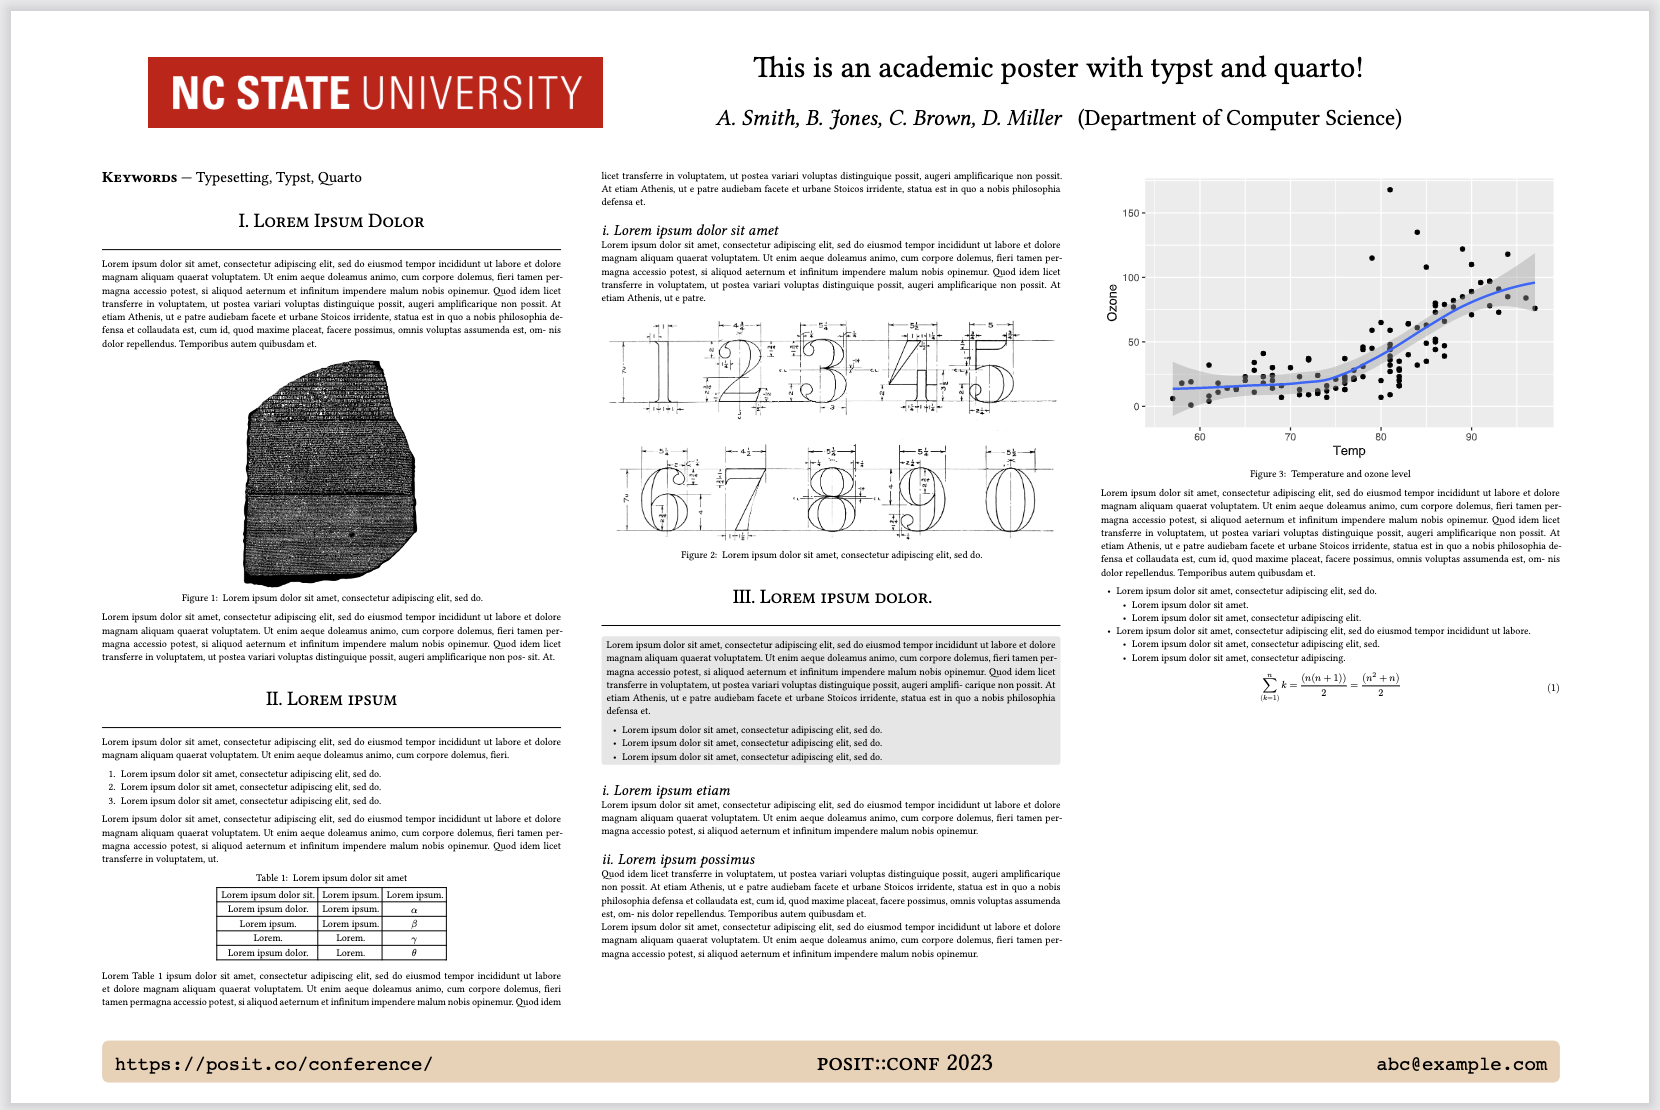
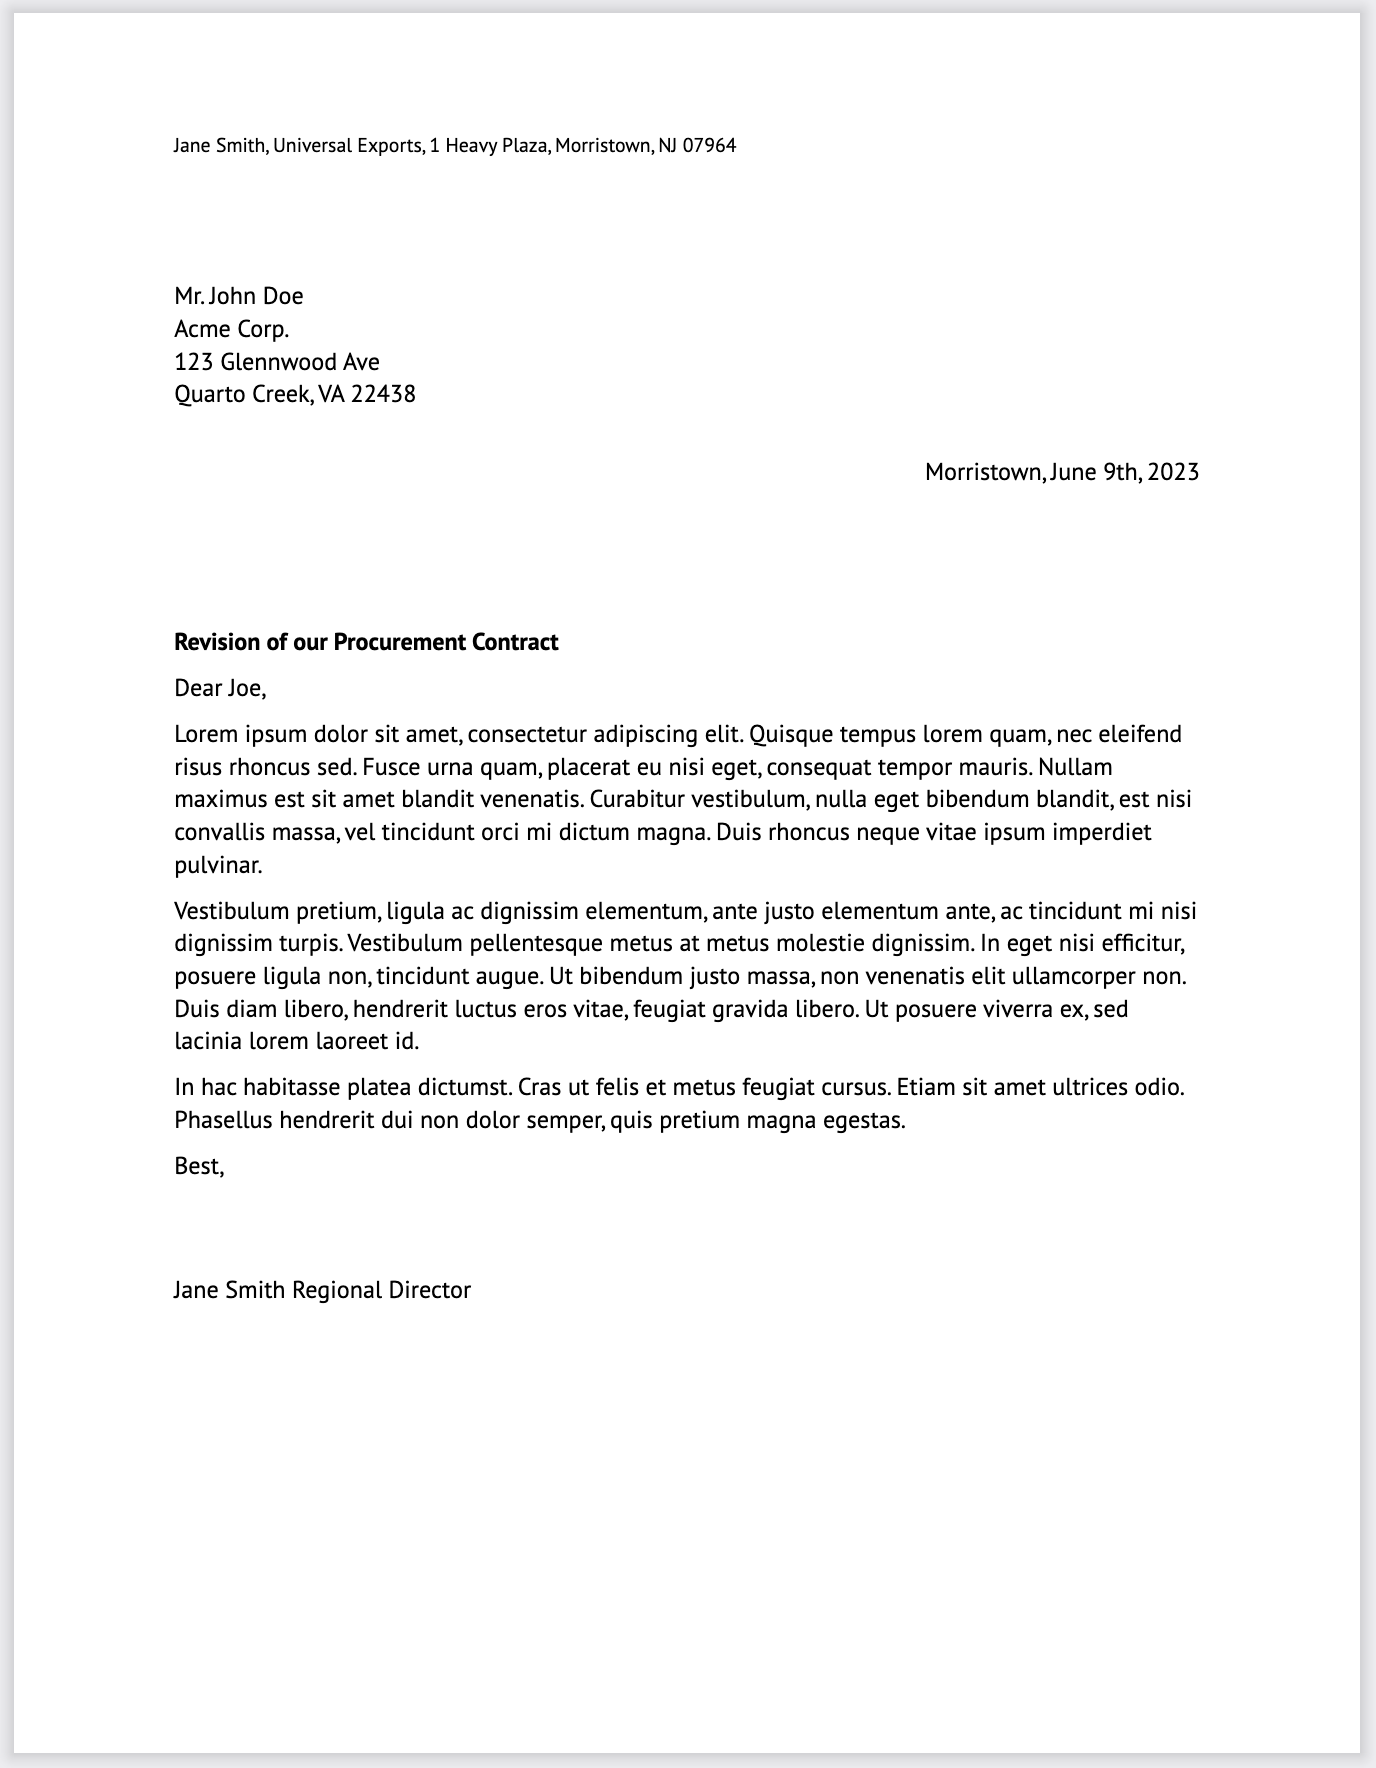
Typst
![]()
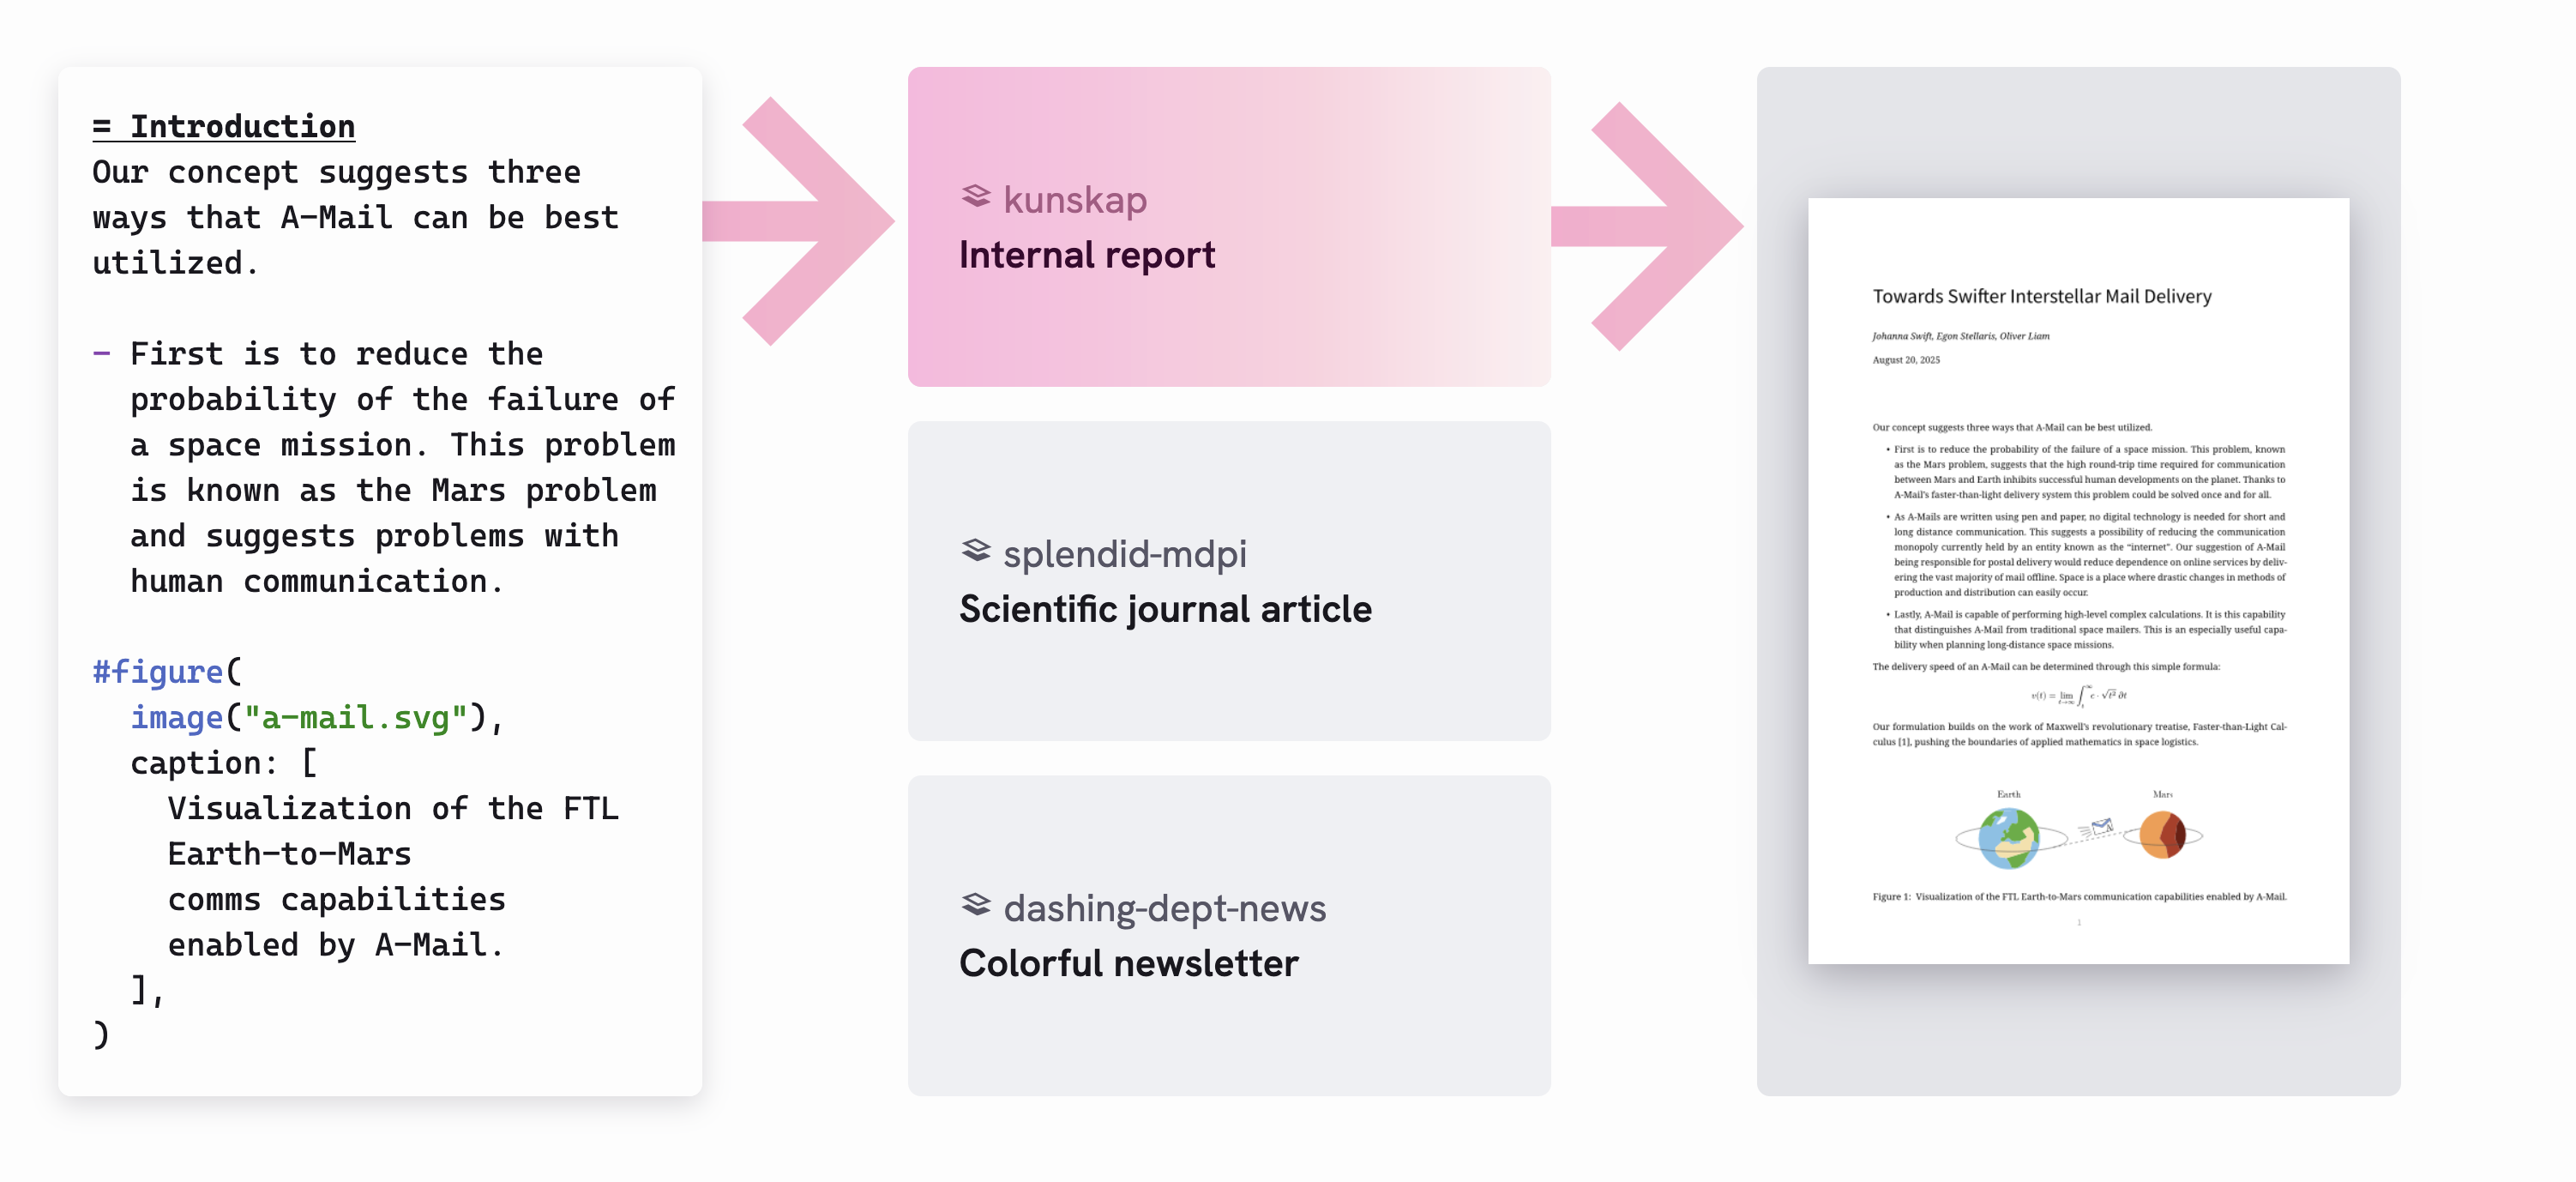
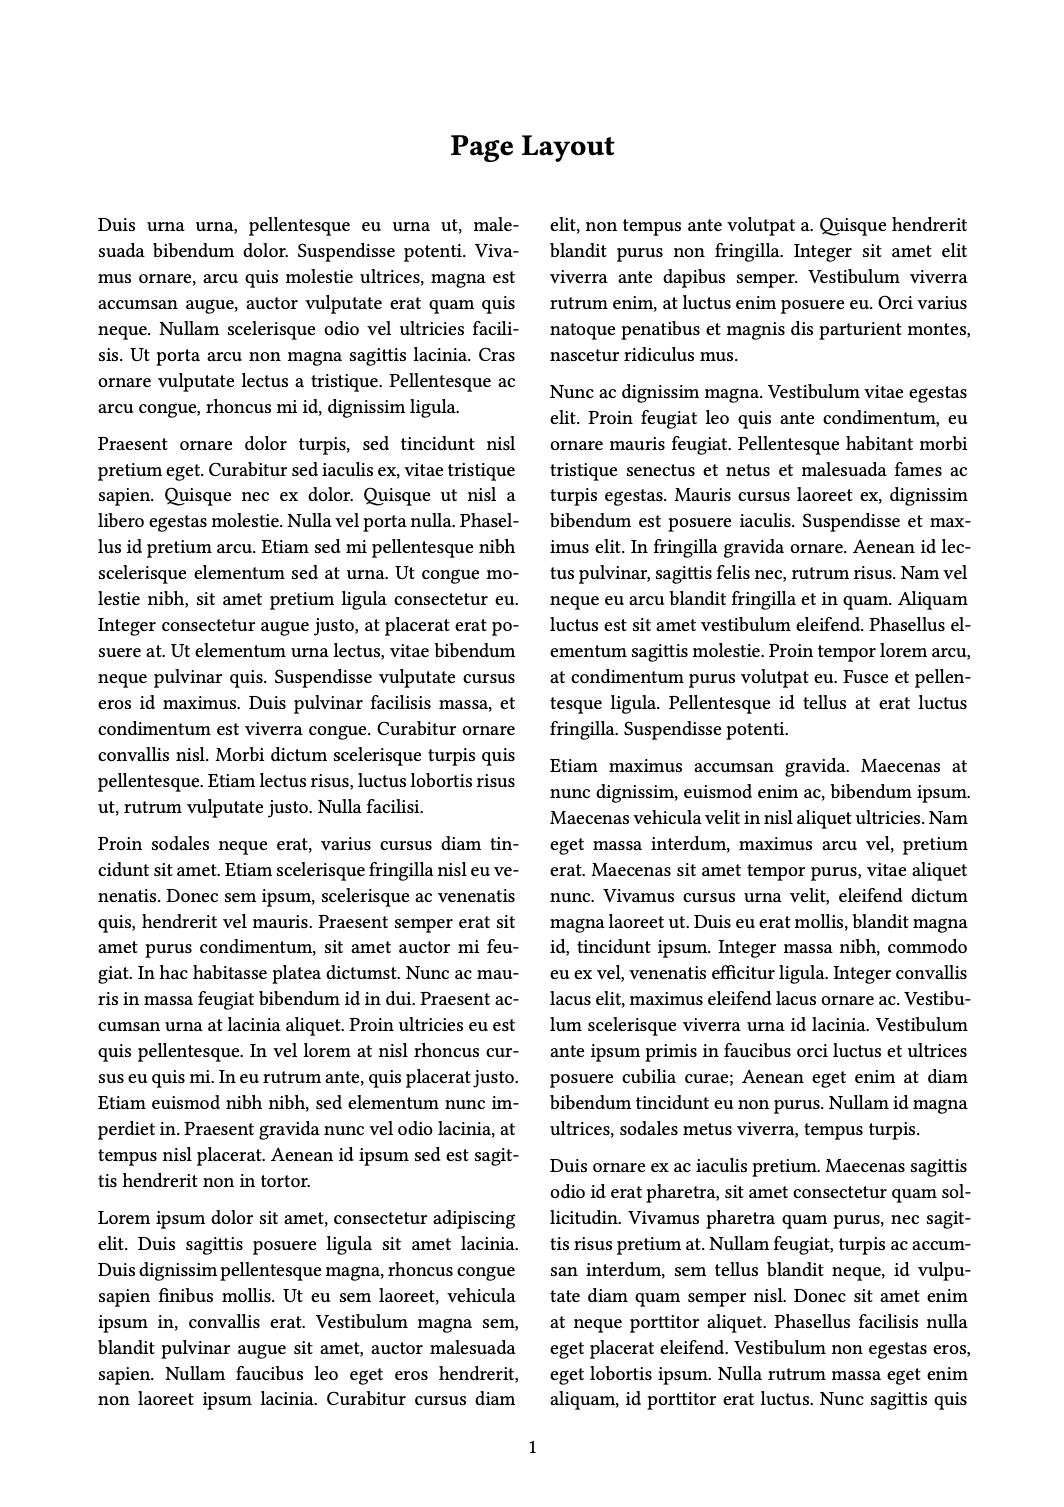
Page layout
Control the size of the page (papersize), the page margins (margin), and the number of columns used for page content (columns):
Custom Typst formats
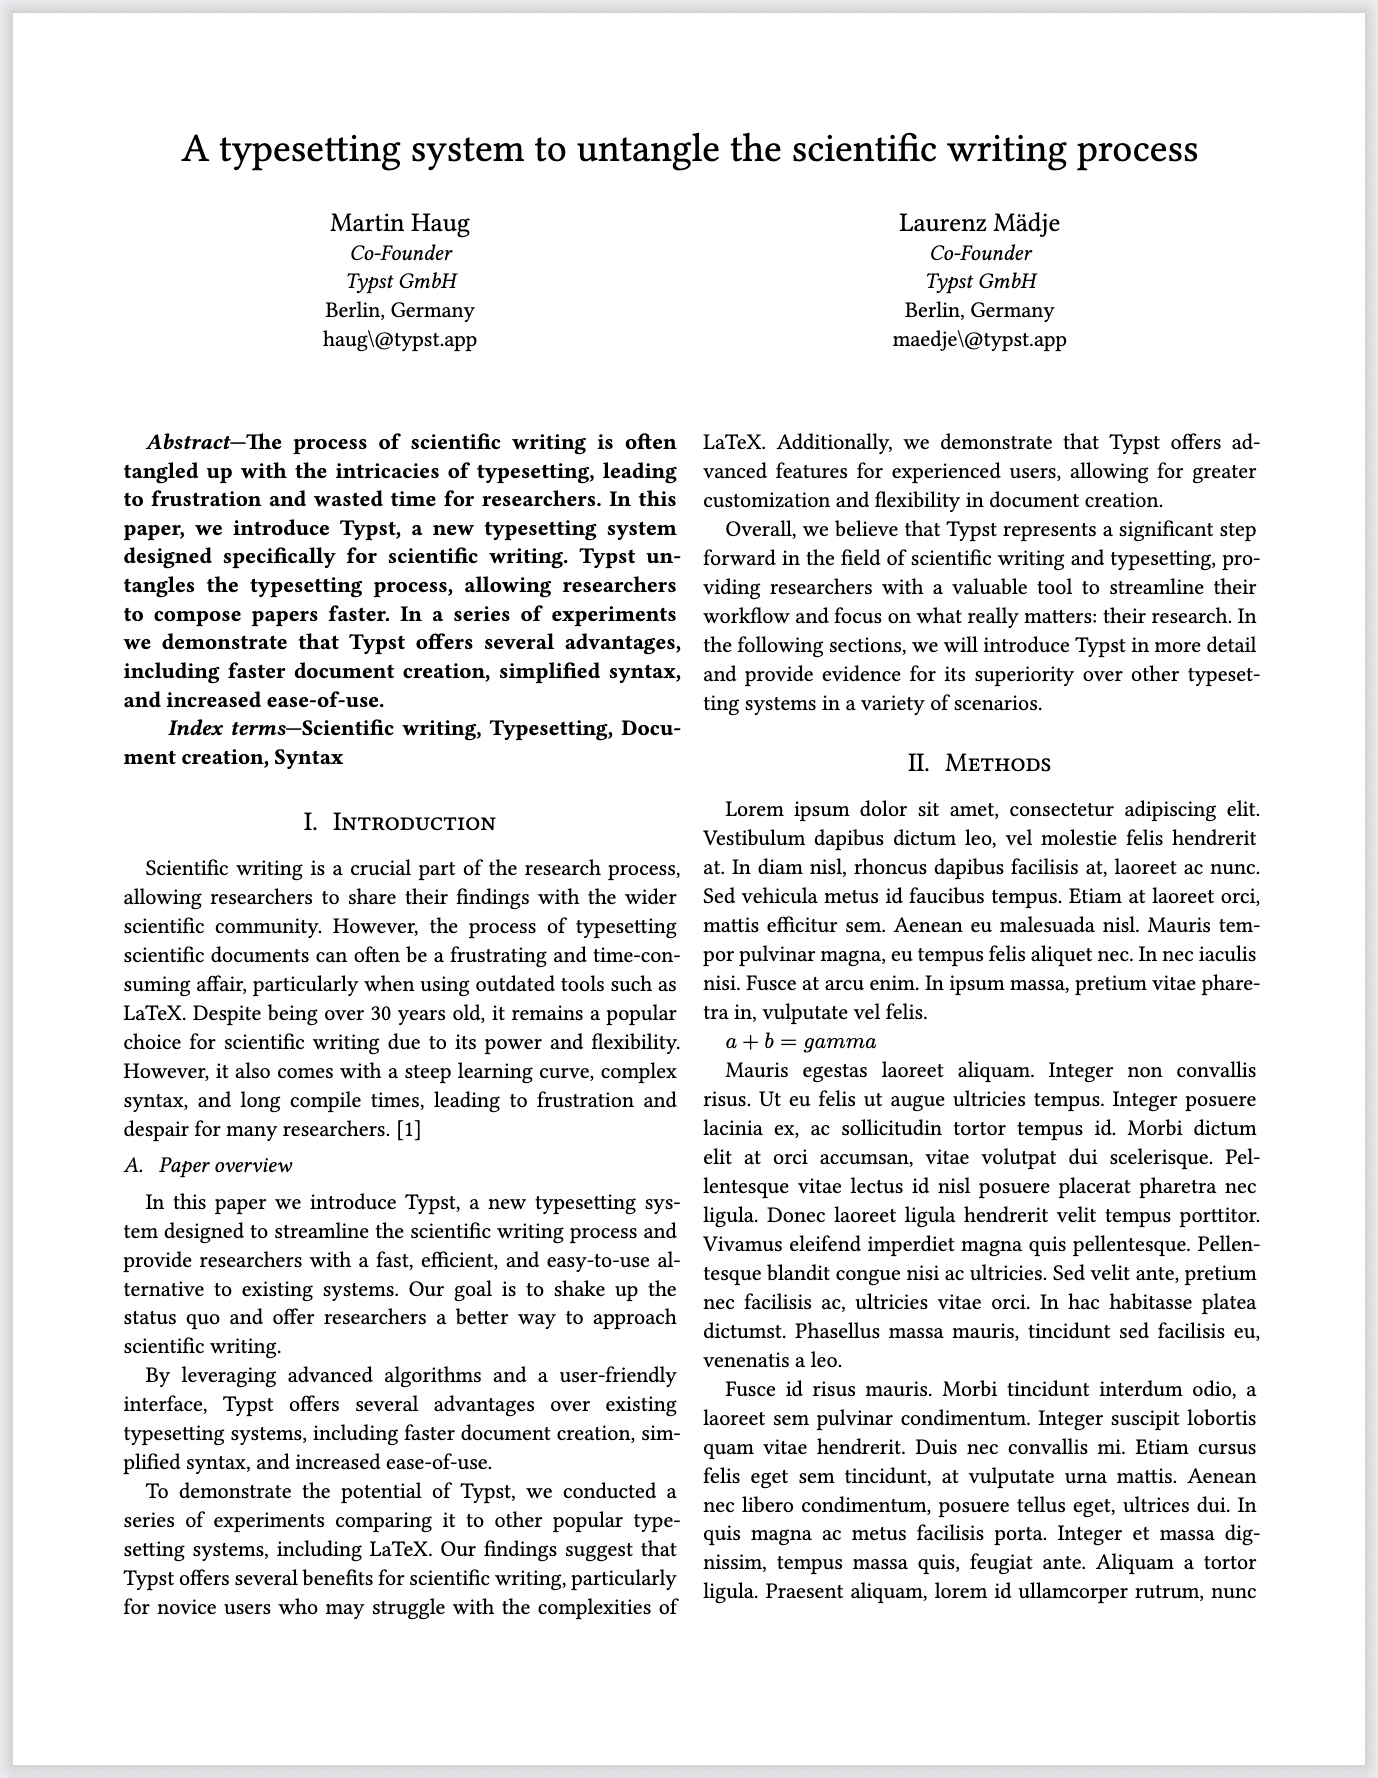

Start from Scratch
Add a card:
Start from scratch
Continue adding cards:
Start from Scratch
Add a title to your cards:
## Rows {auto-animate=true}
By default, cards are laid out in rows:
Rows
By default, cards are laid out in rows:
Columns
We can change it to be columns instead:
Headings
Alternatively, we can use headings to arrange cards:
Headings
Make another row with content:
Headings
Continue adding content:
Headings
We can add columns within our rows:
Tabsets
Or use tabsets to put content in different tabs:
Tabsets
Pages
Use a Level 1 heading to create new pages:
Pages
Use a Level 1 heading to create new pages:
Navigation
Add a logo and buttons to your navigation bar:
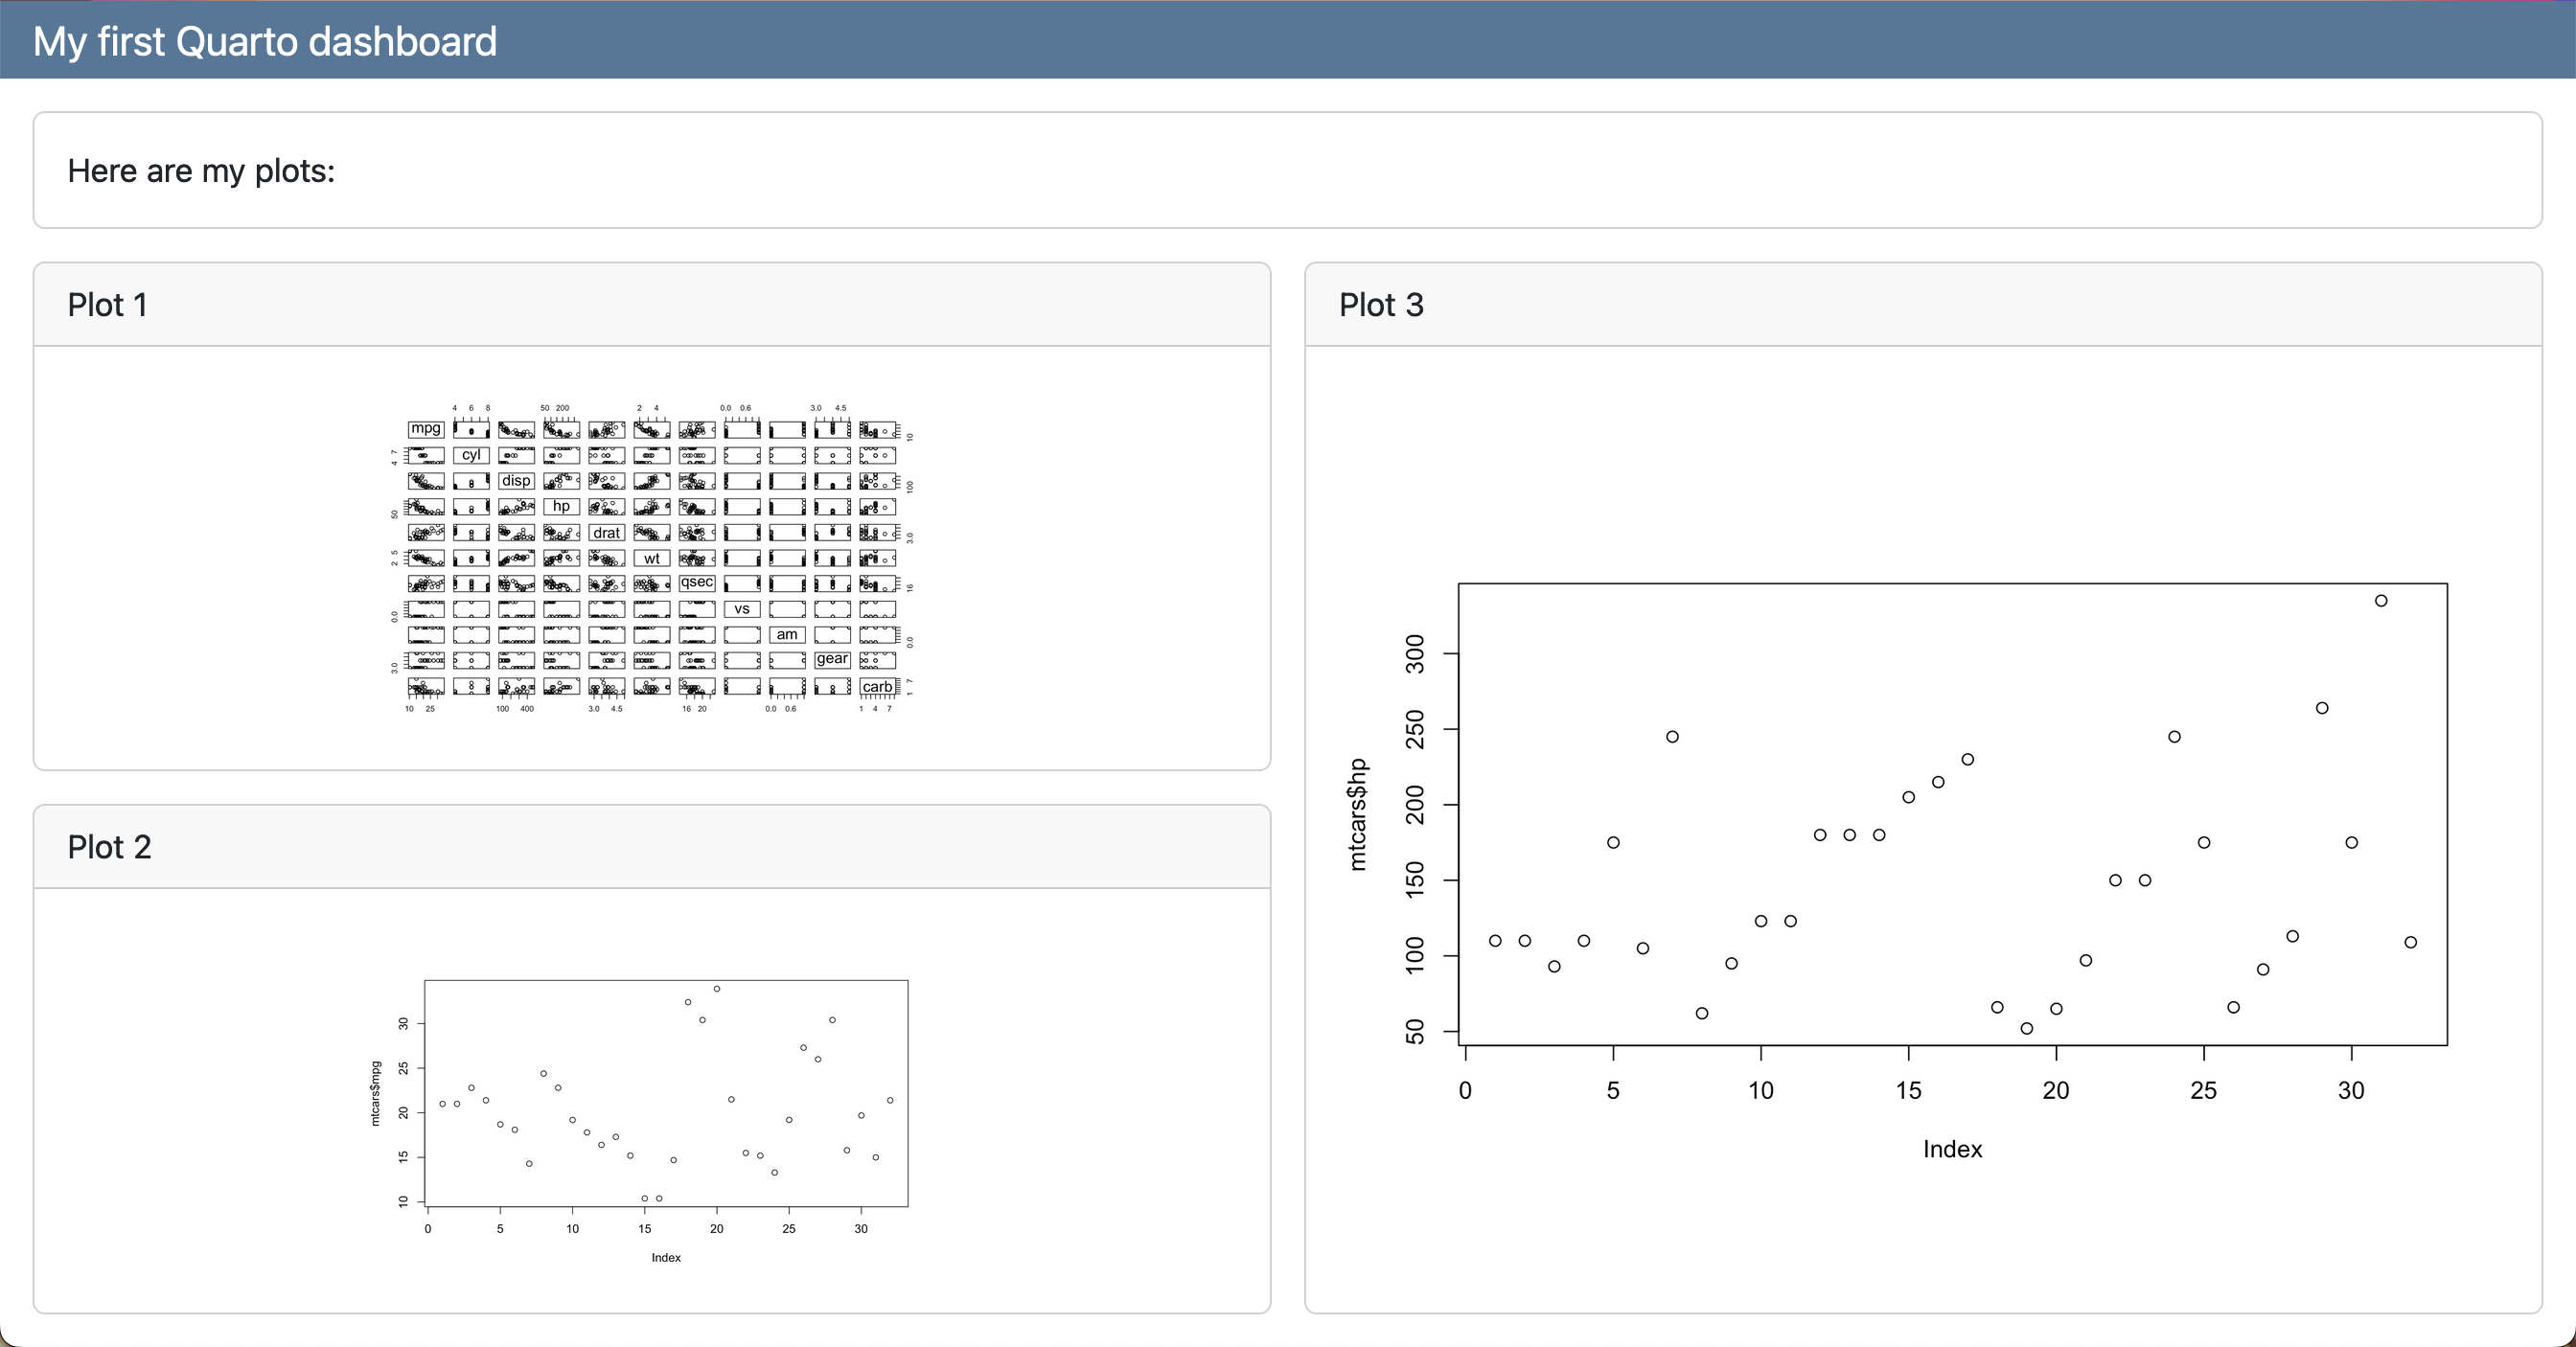
dashboard.qmd
---
title: "My first Quarto dashboard"
format:
dashboard:
logo: images/car.png
nav-buttons:
- reddit
- icon: gitlab
href: https://gitlab.com/
---
## Row
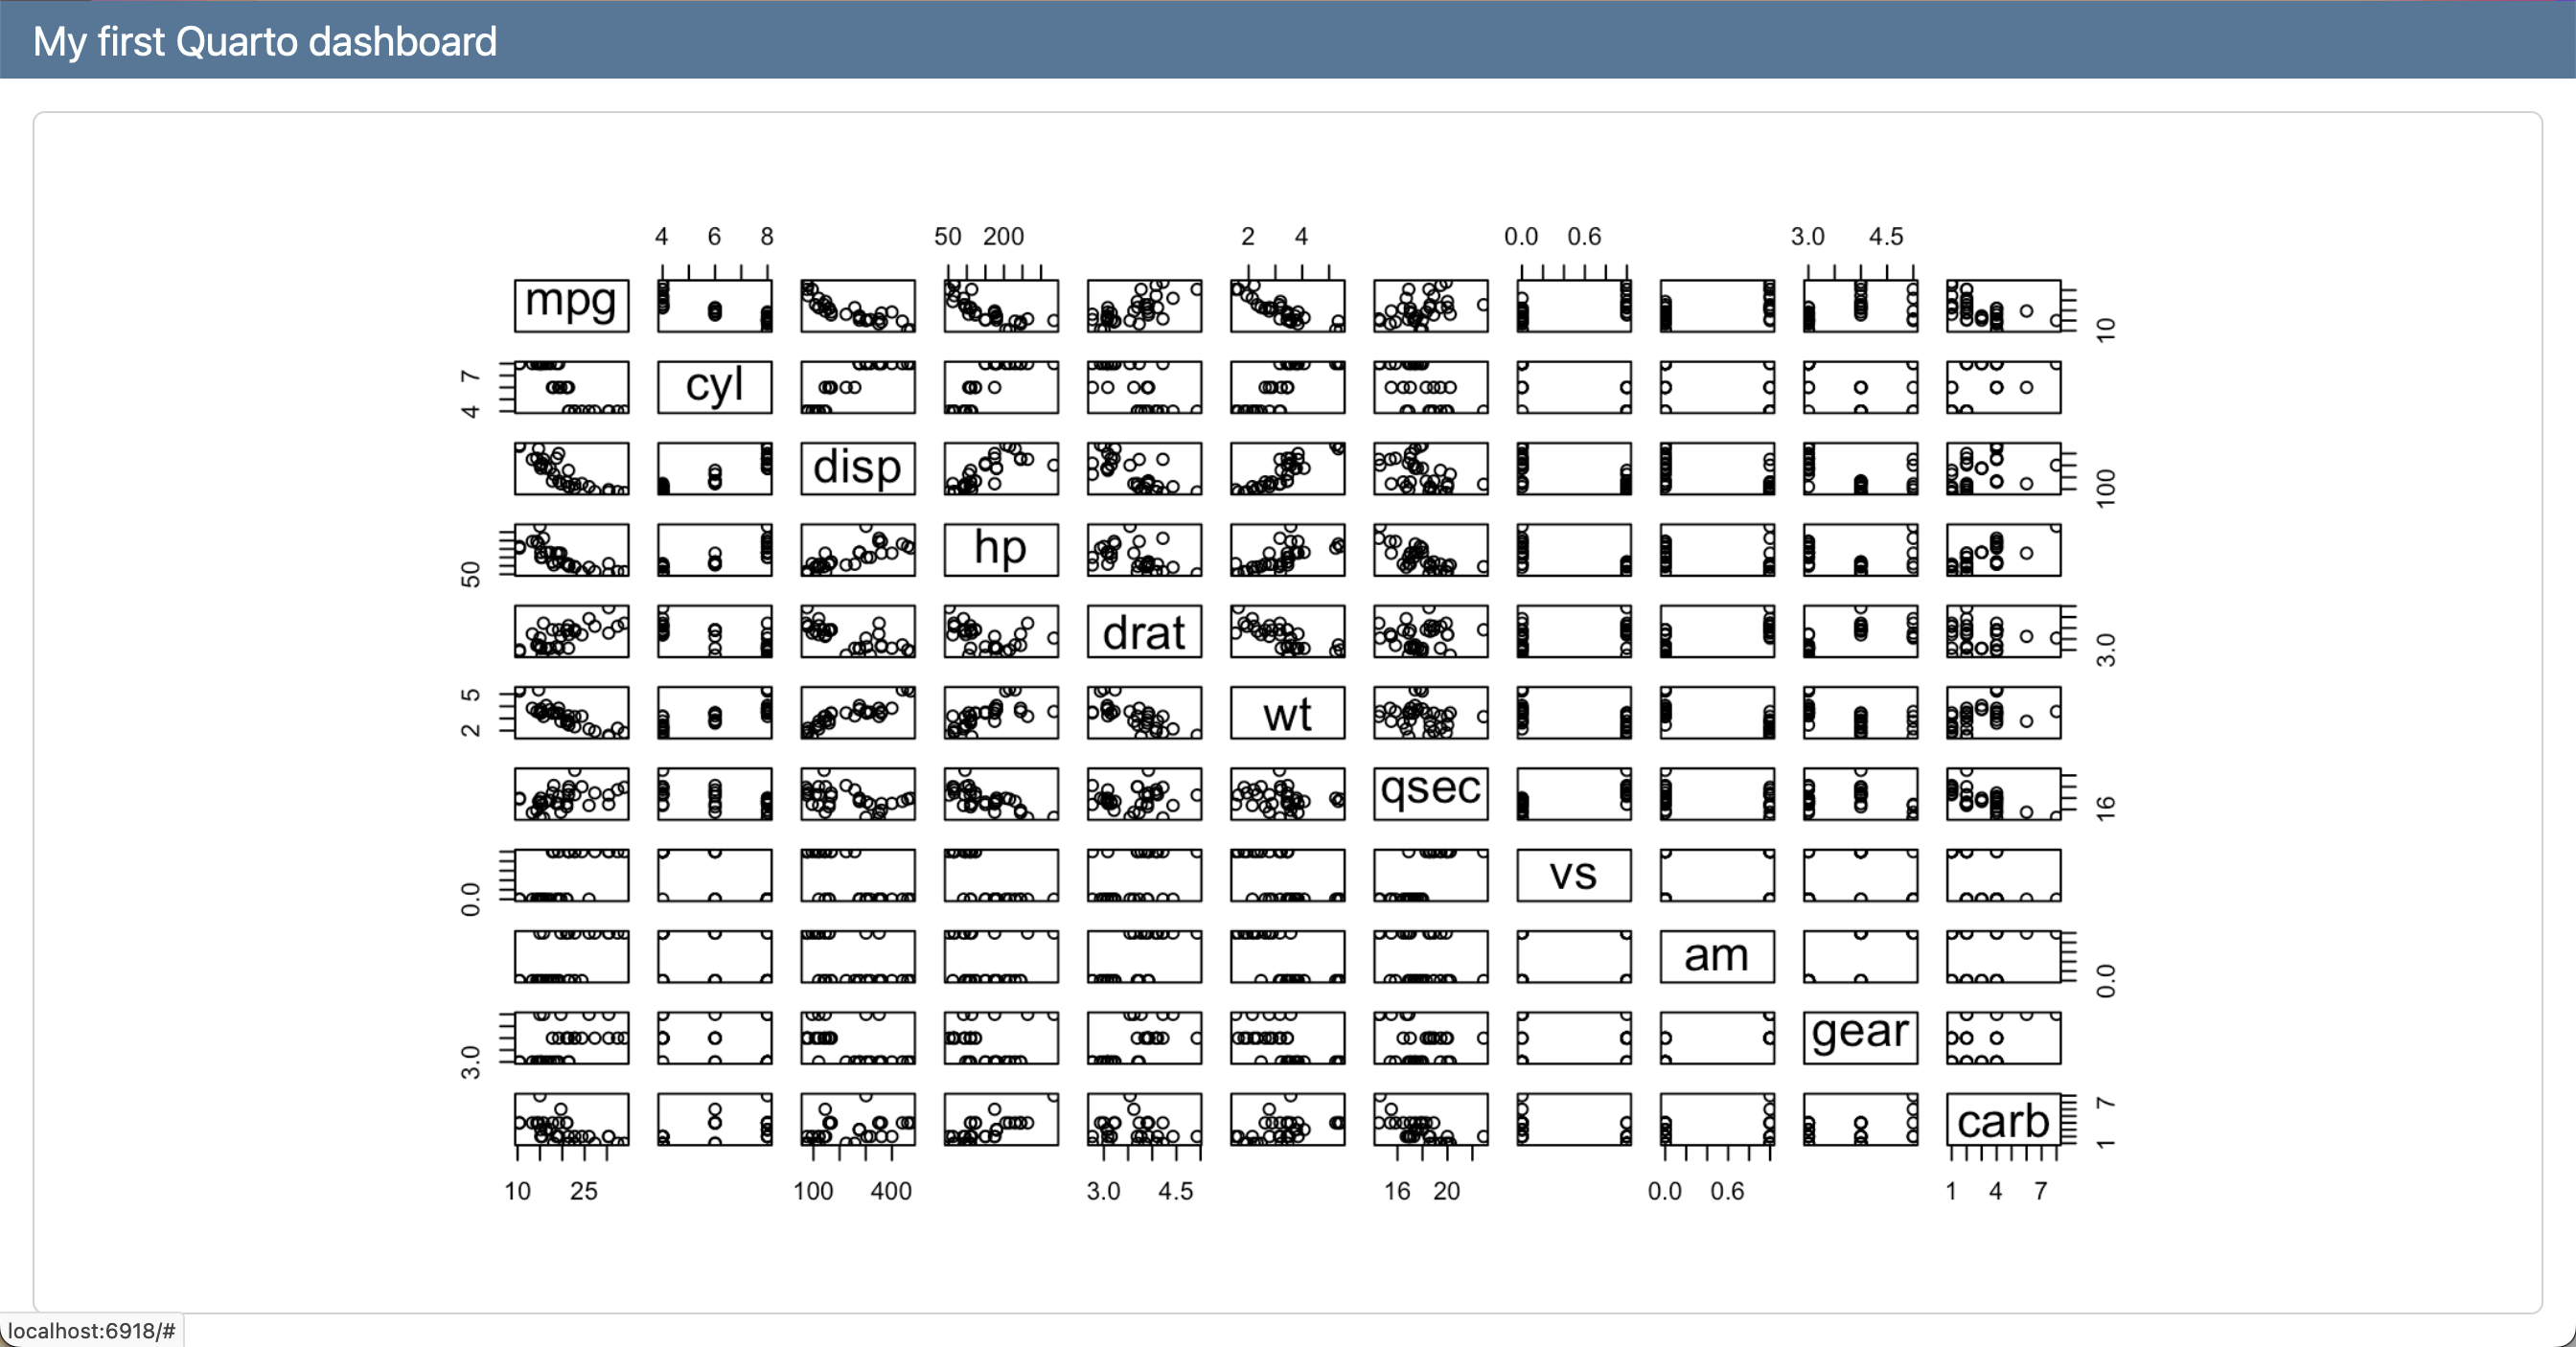
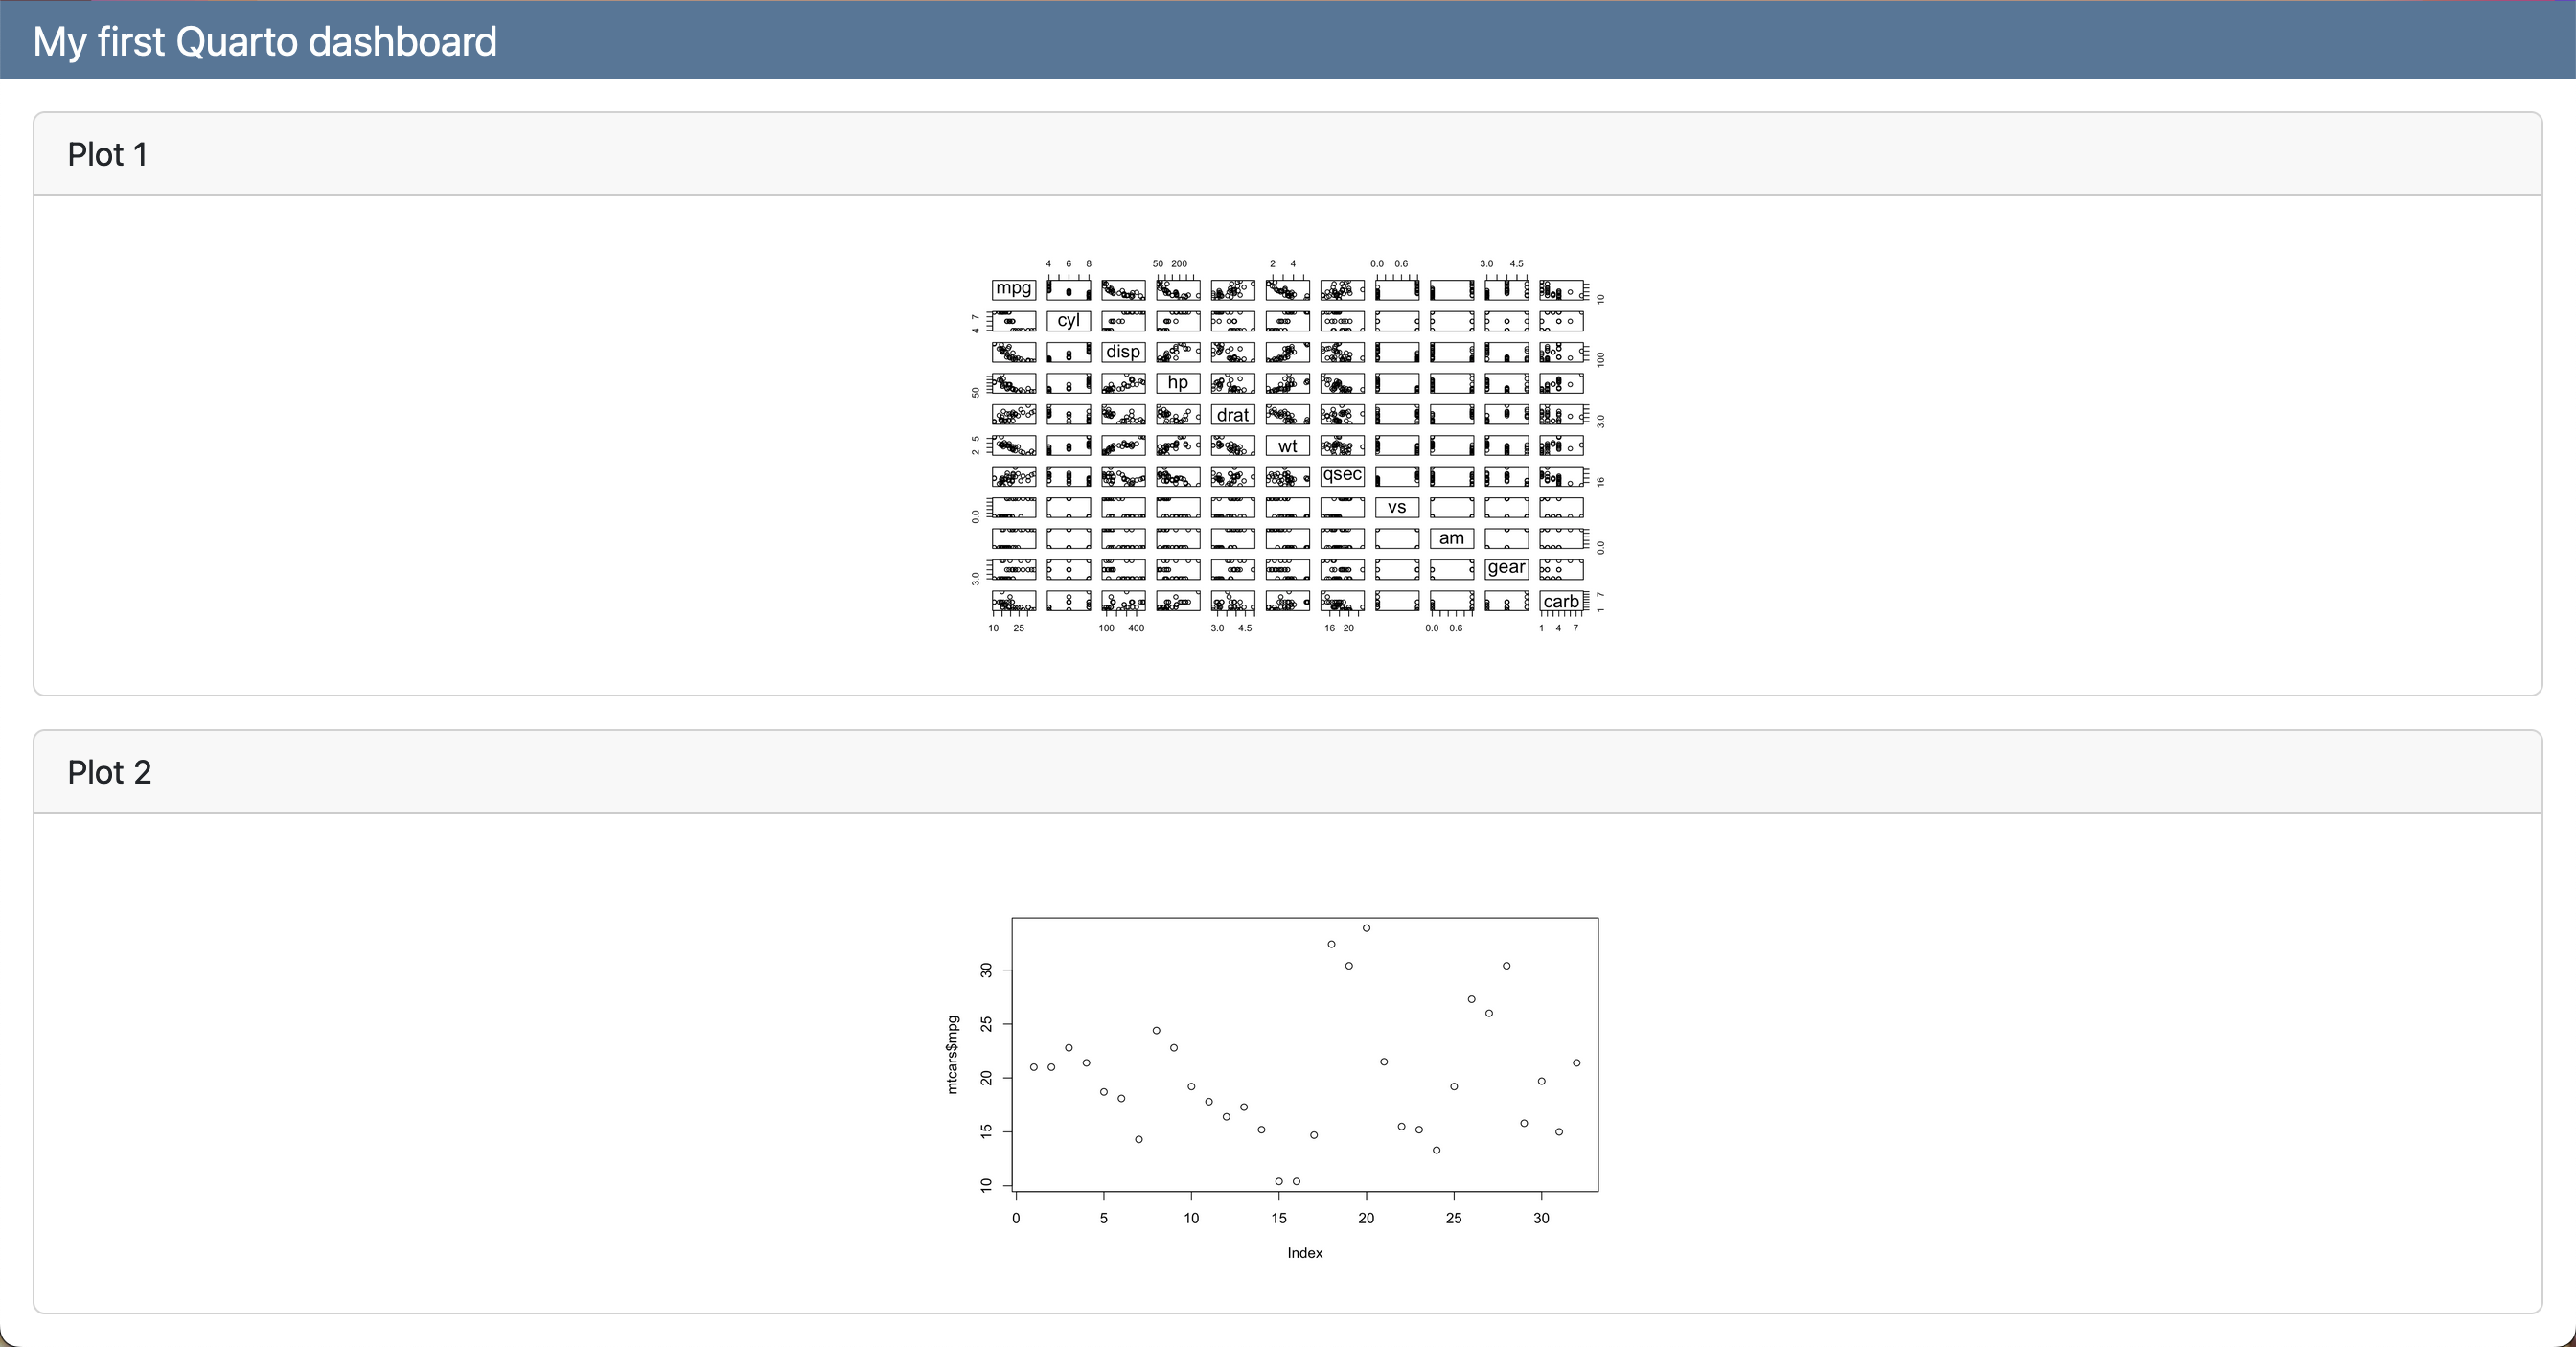
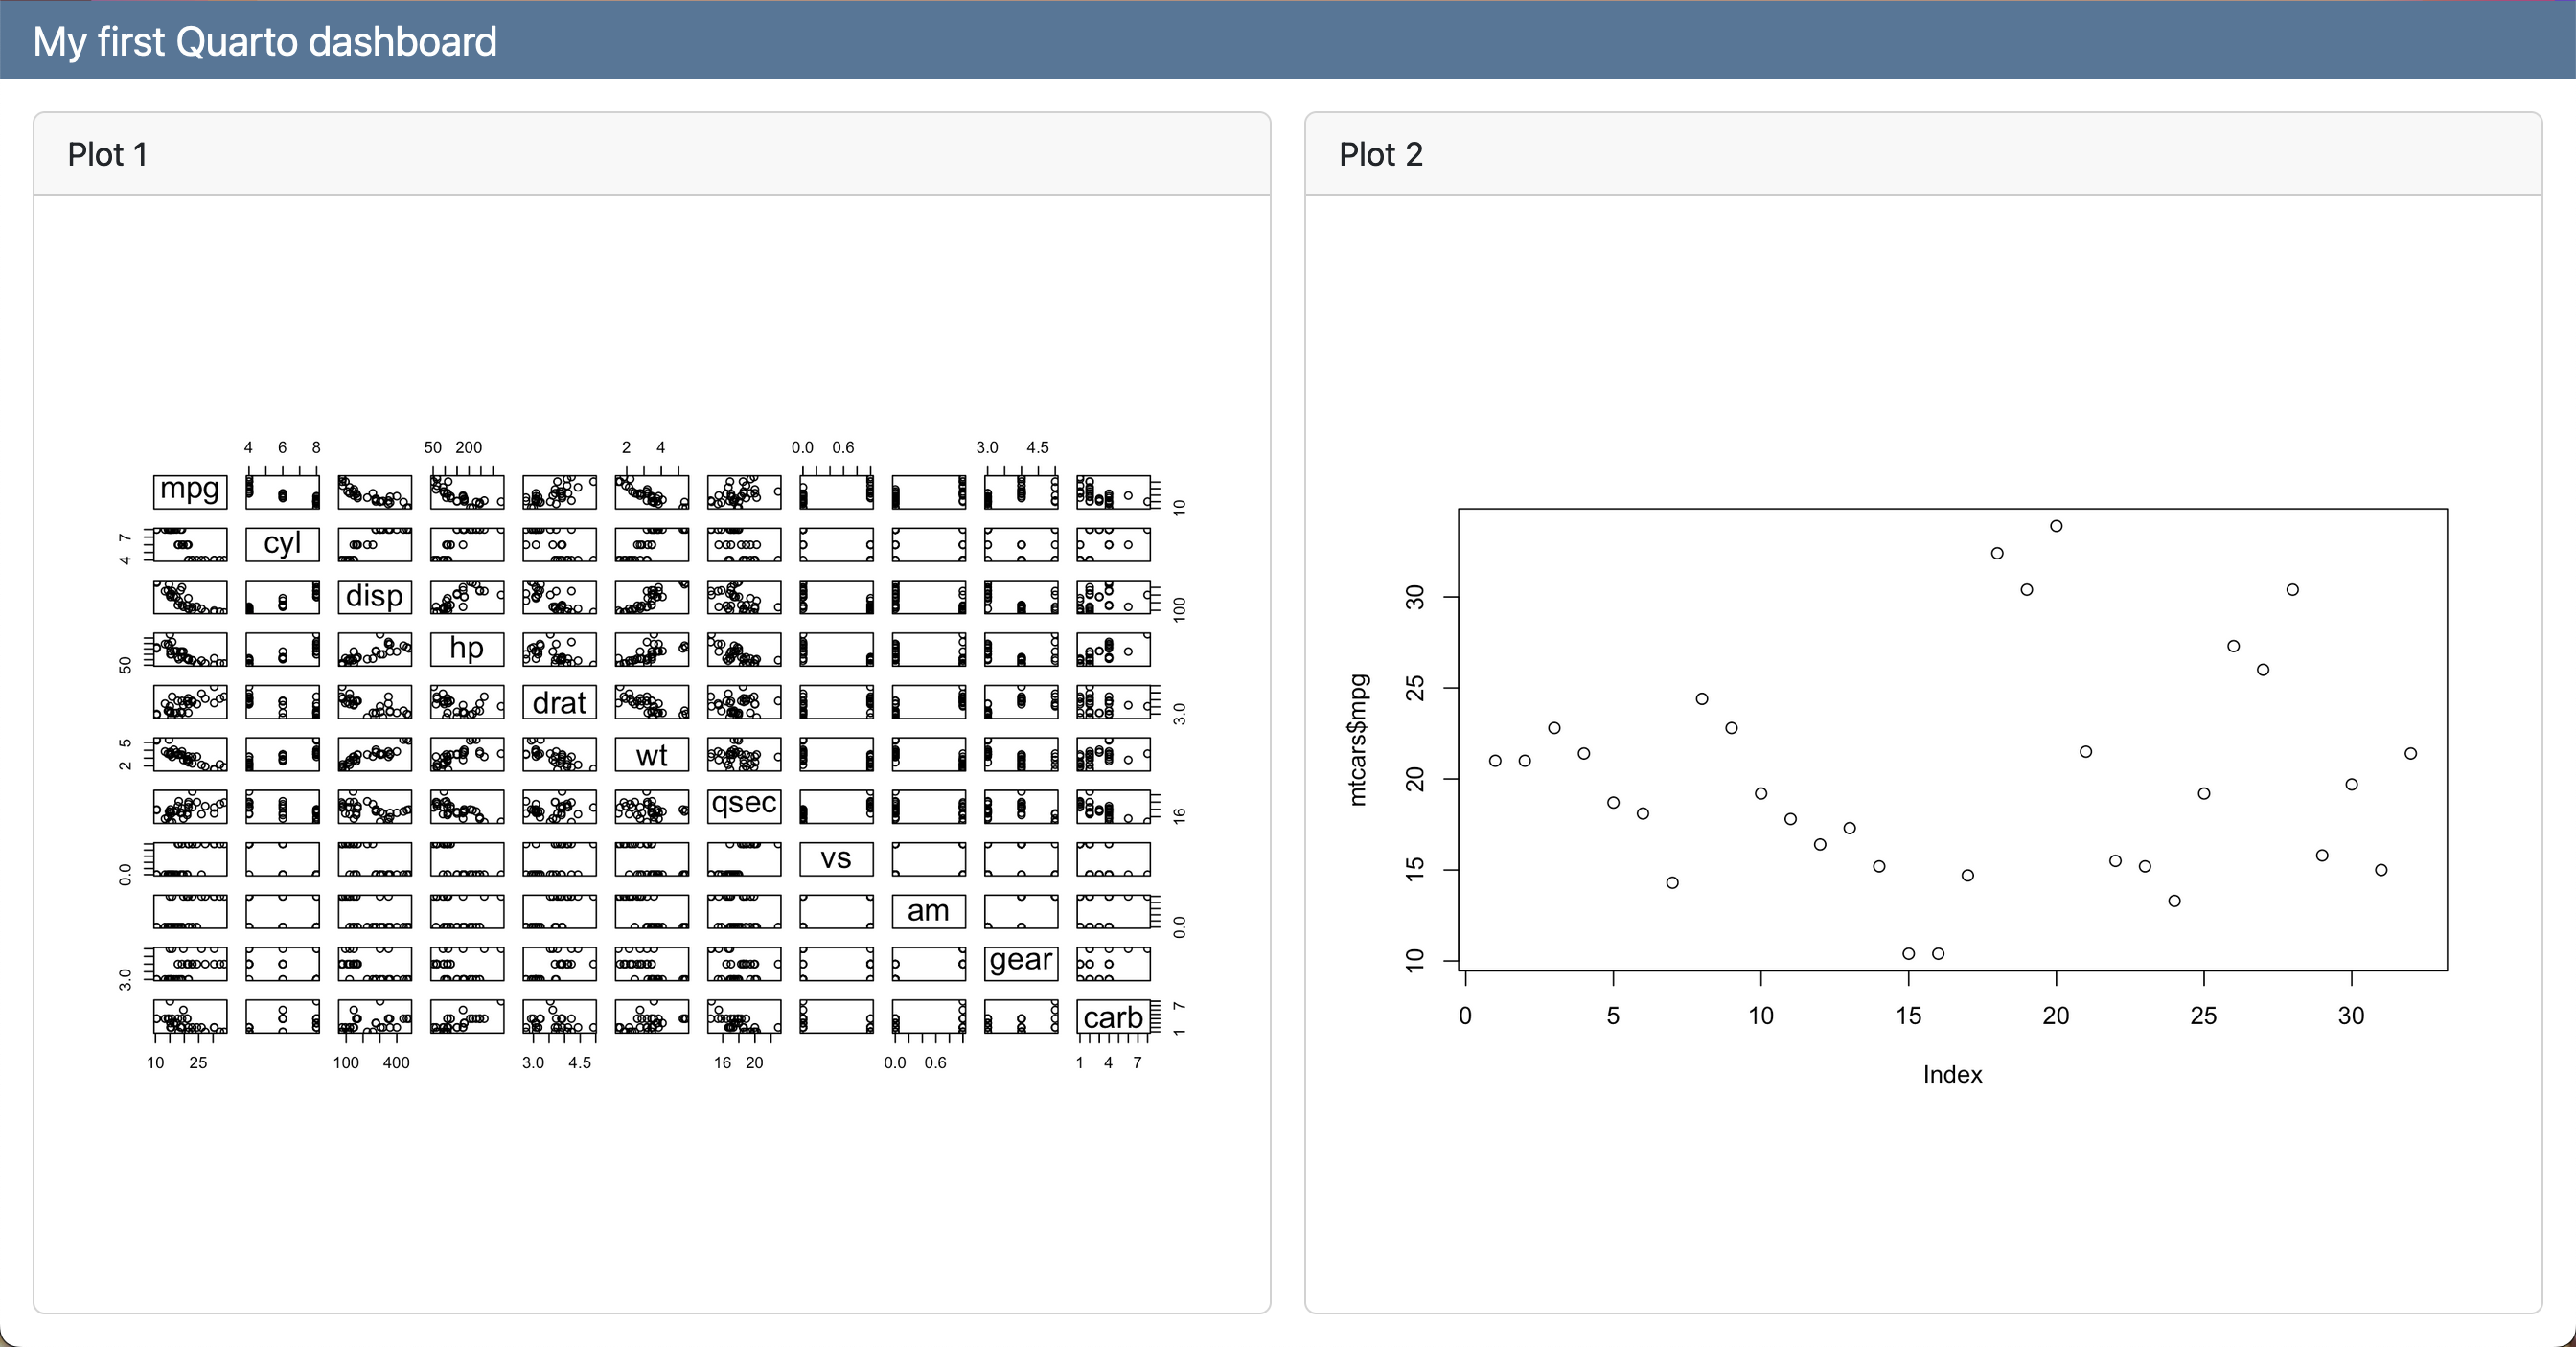
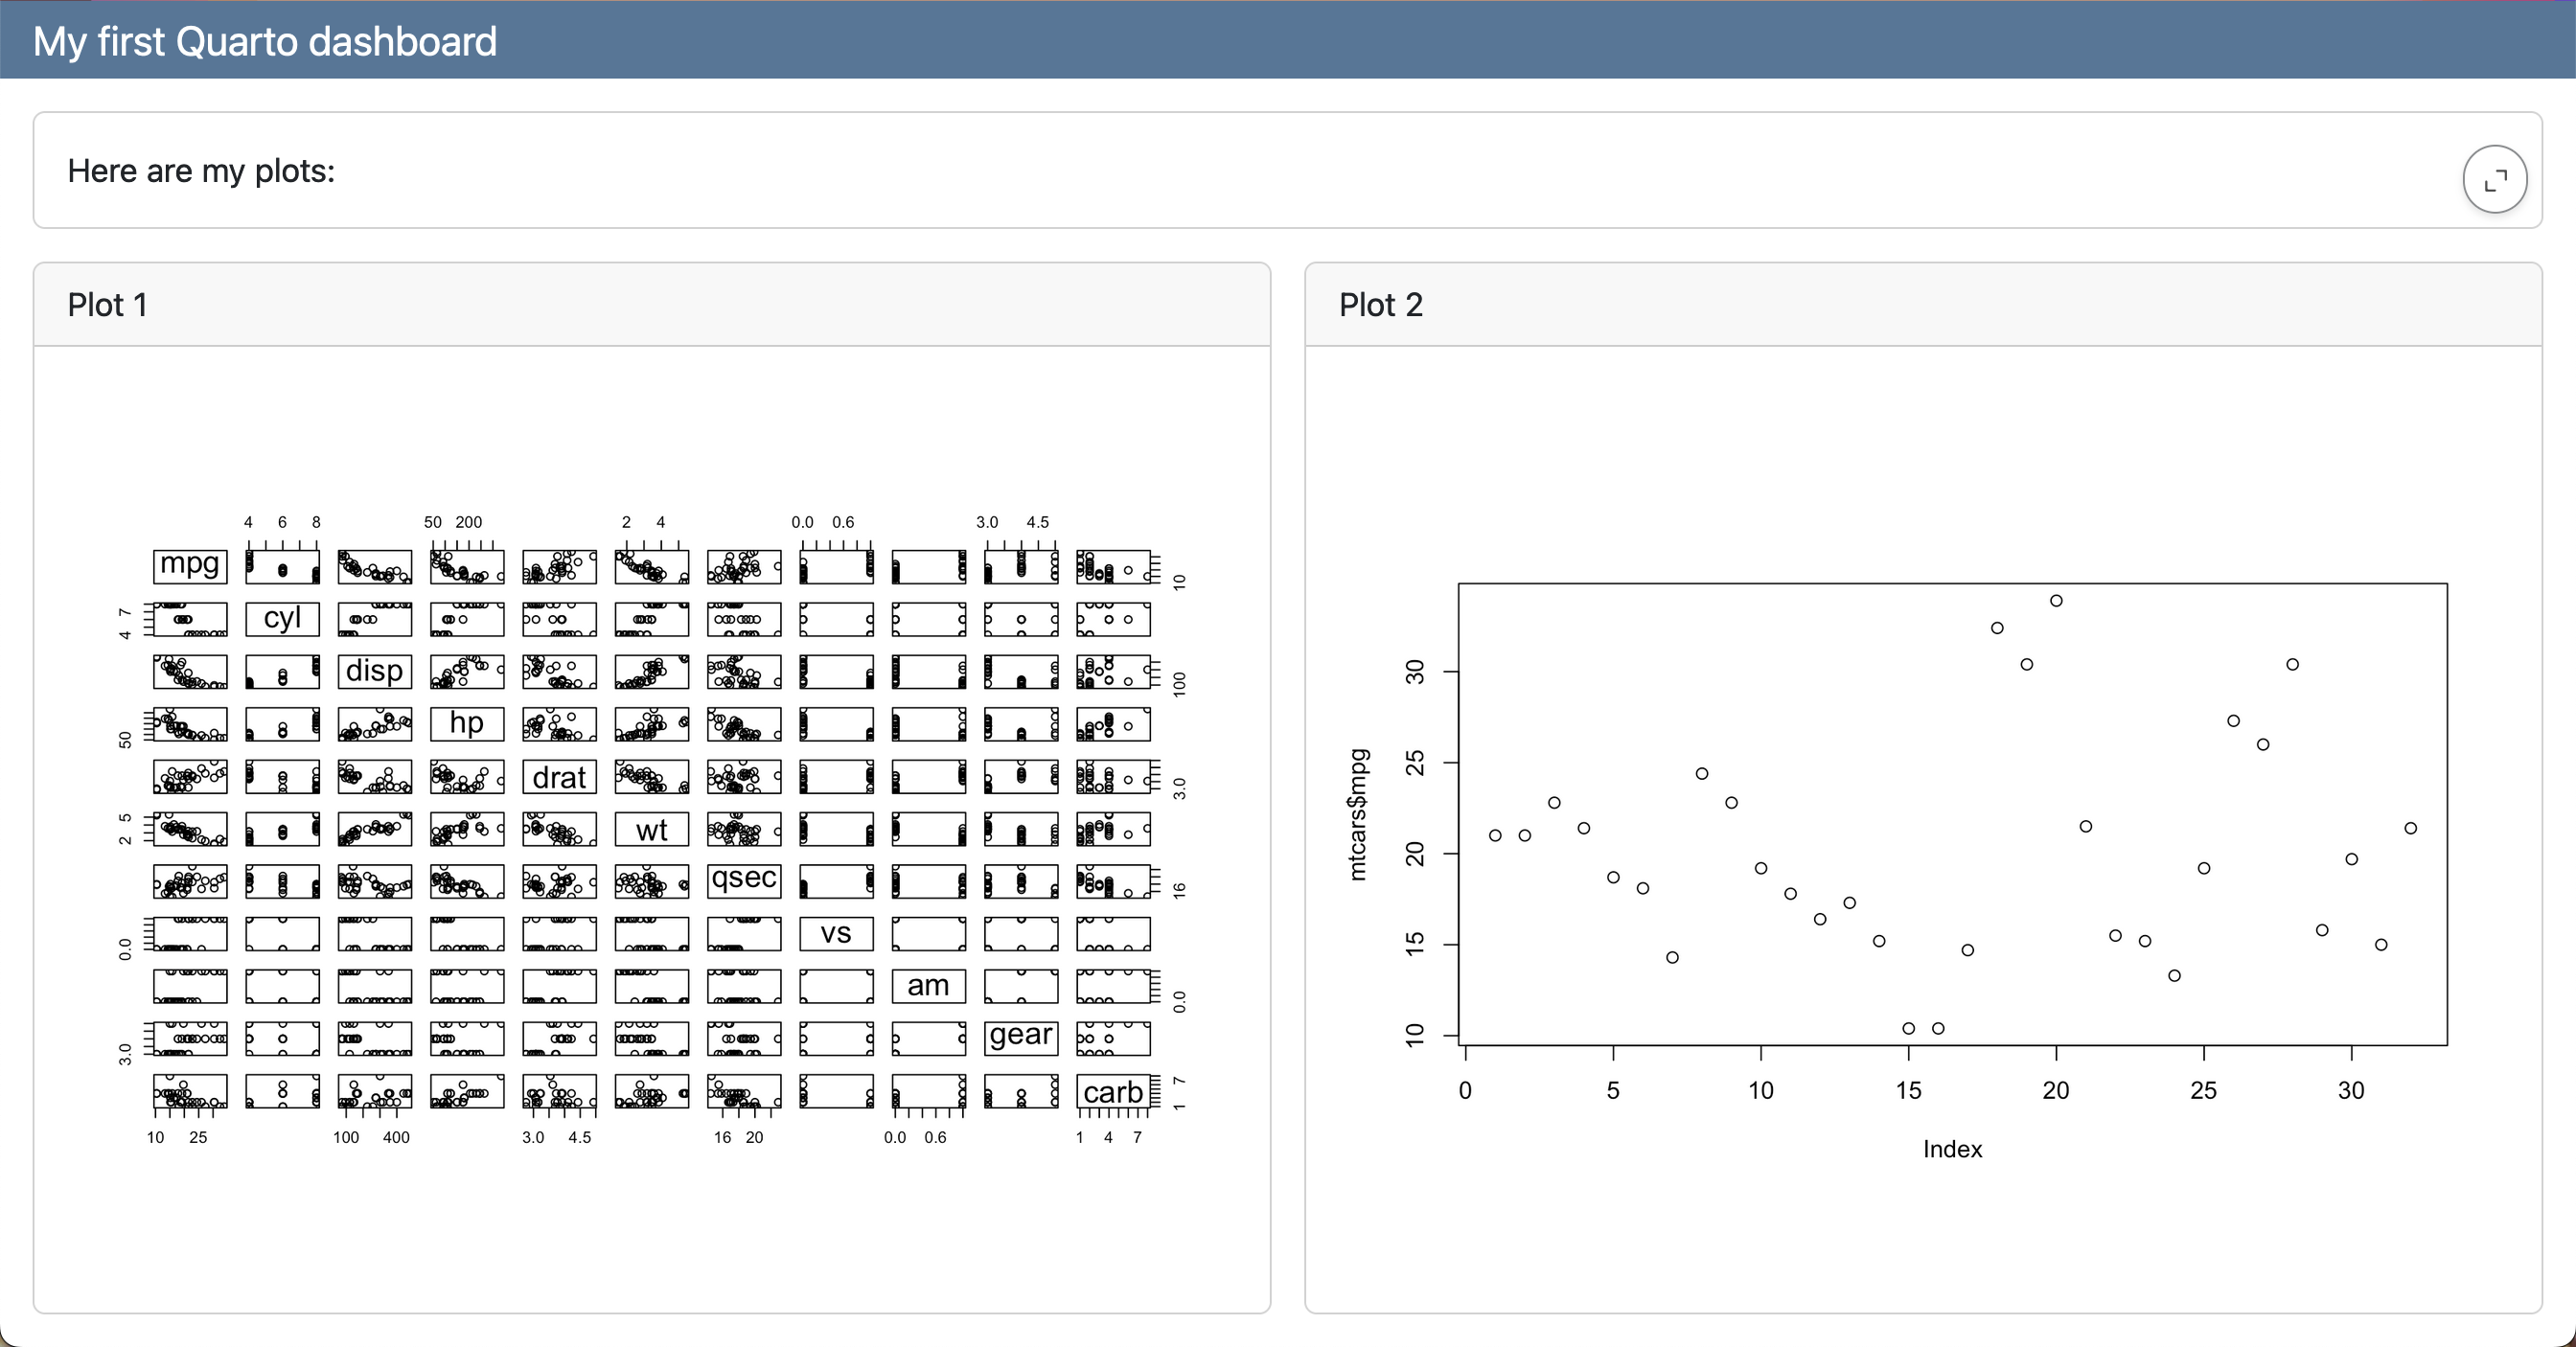
Here is my dashboard:
# Page 1
```{r}
#| title: "Plot 1"
plot(mtcars)
```
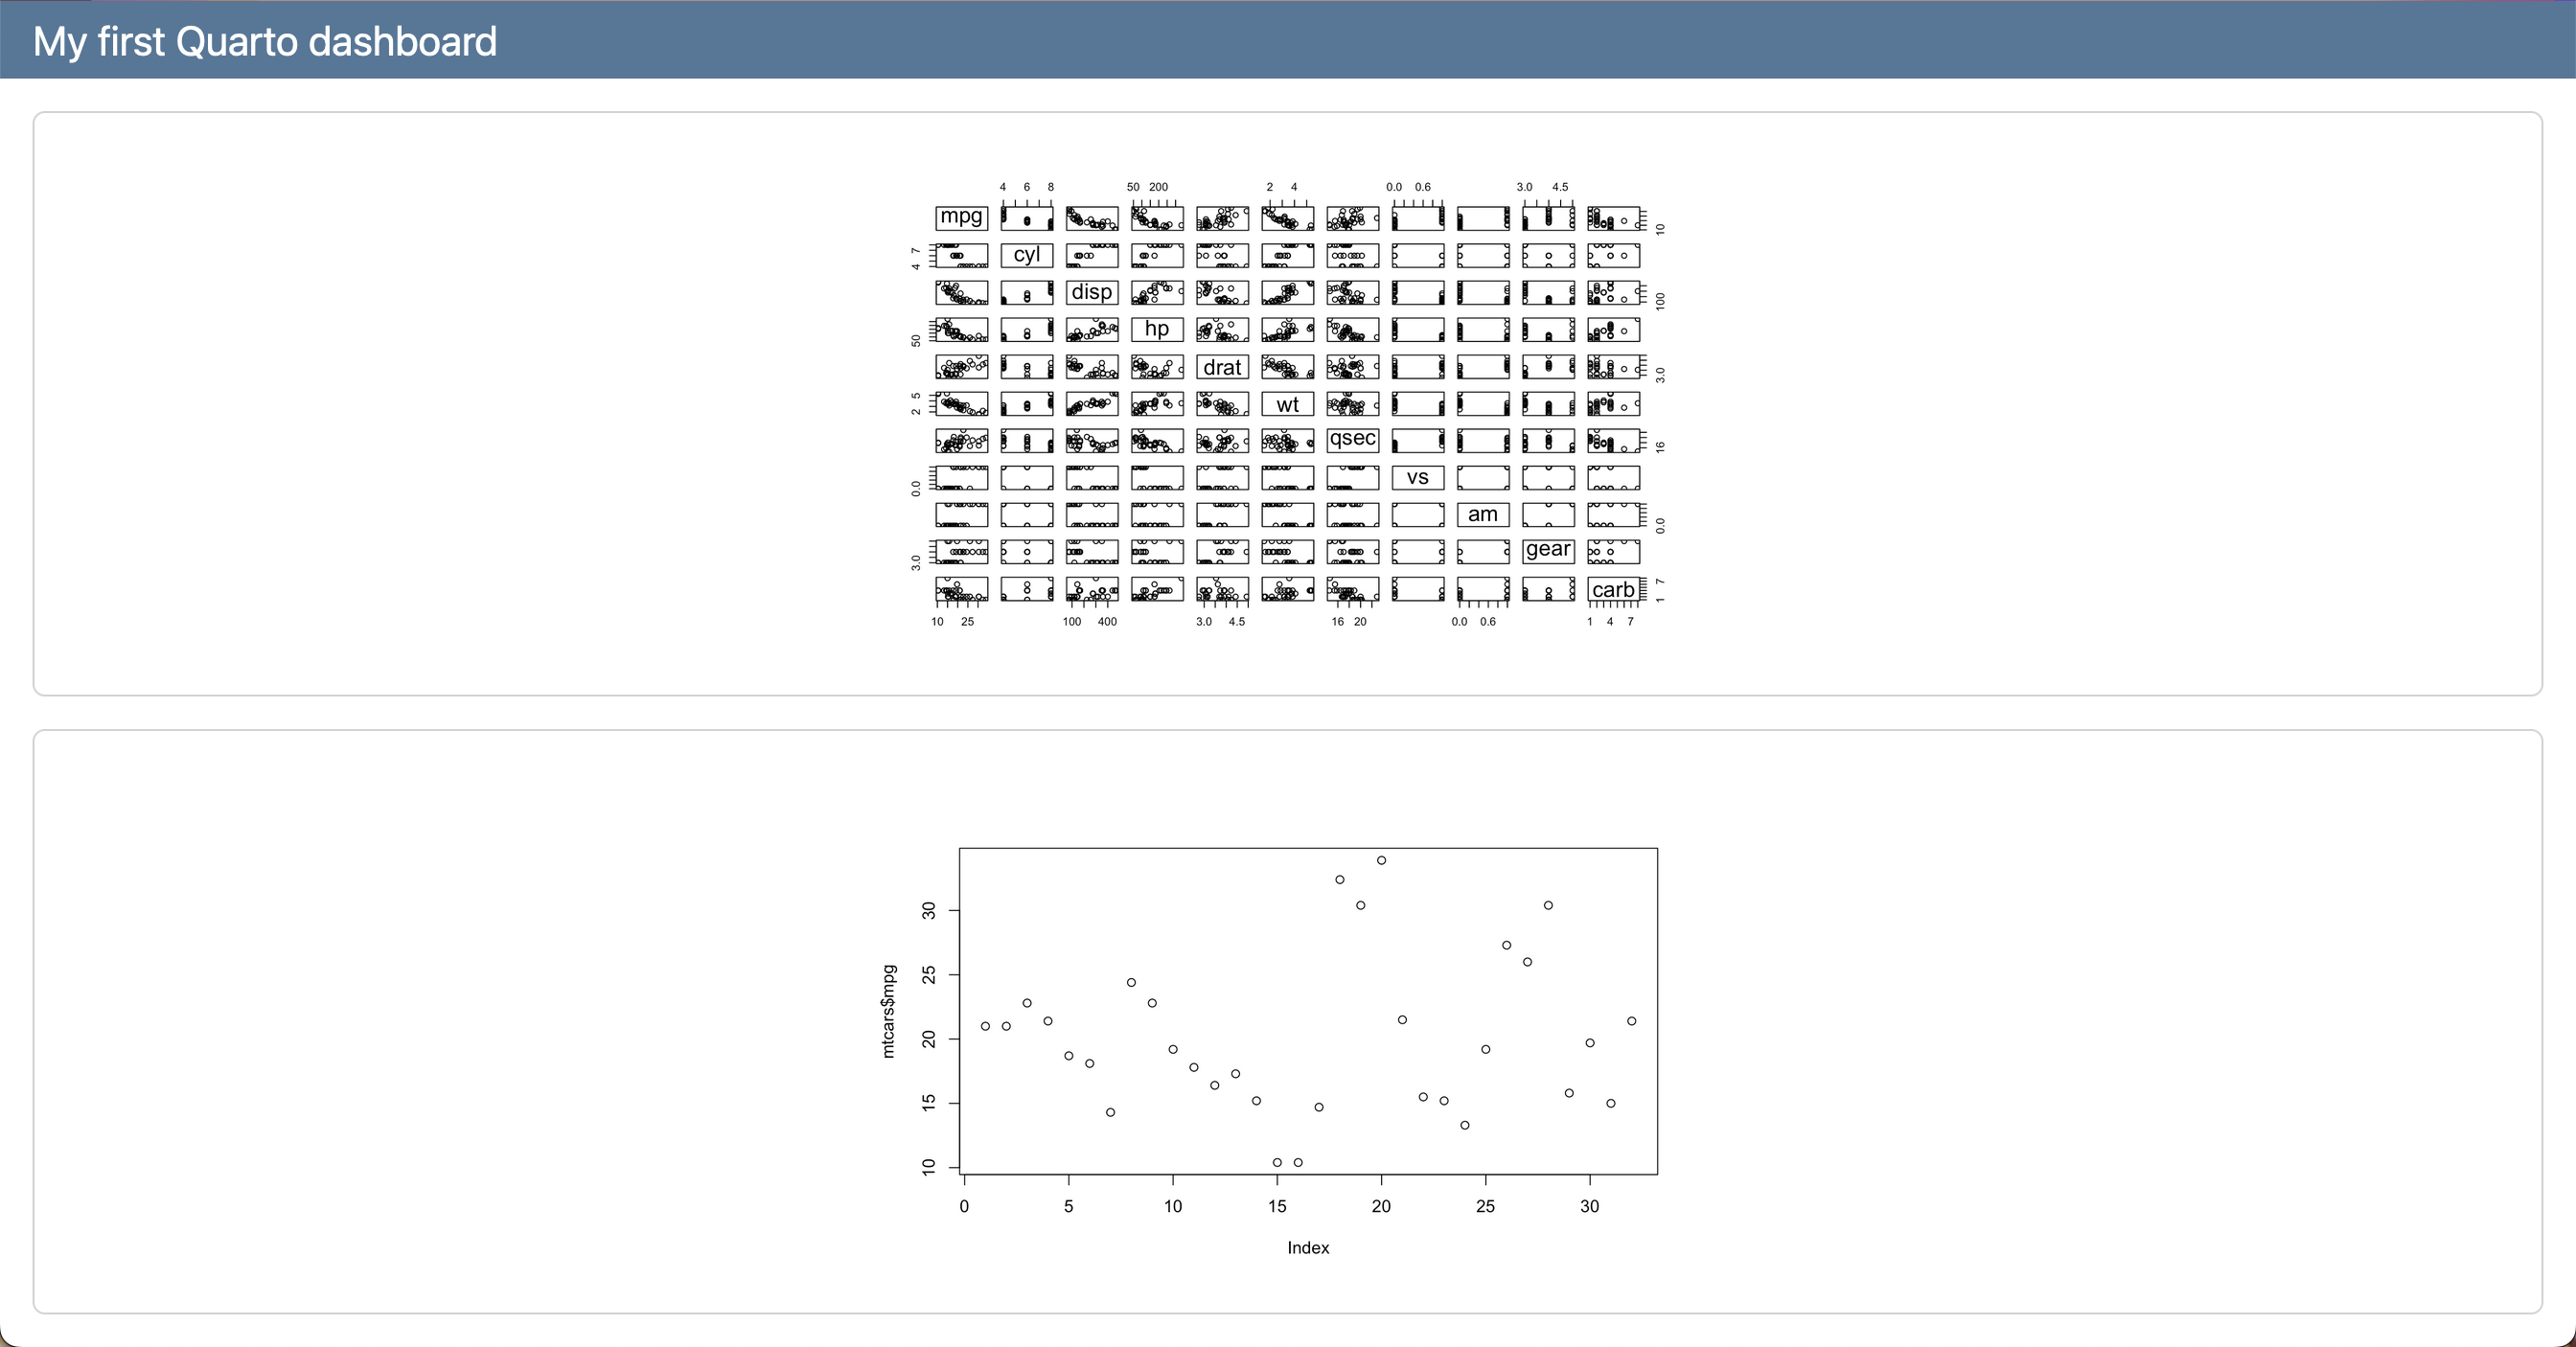
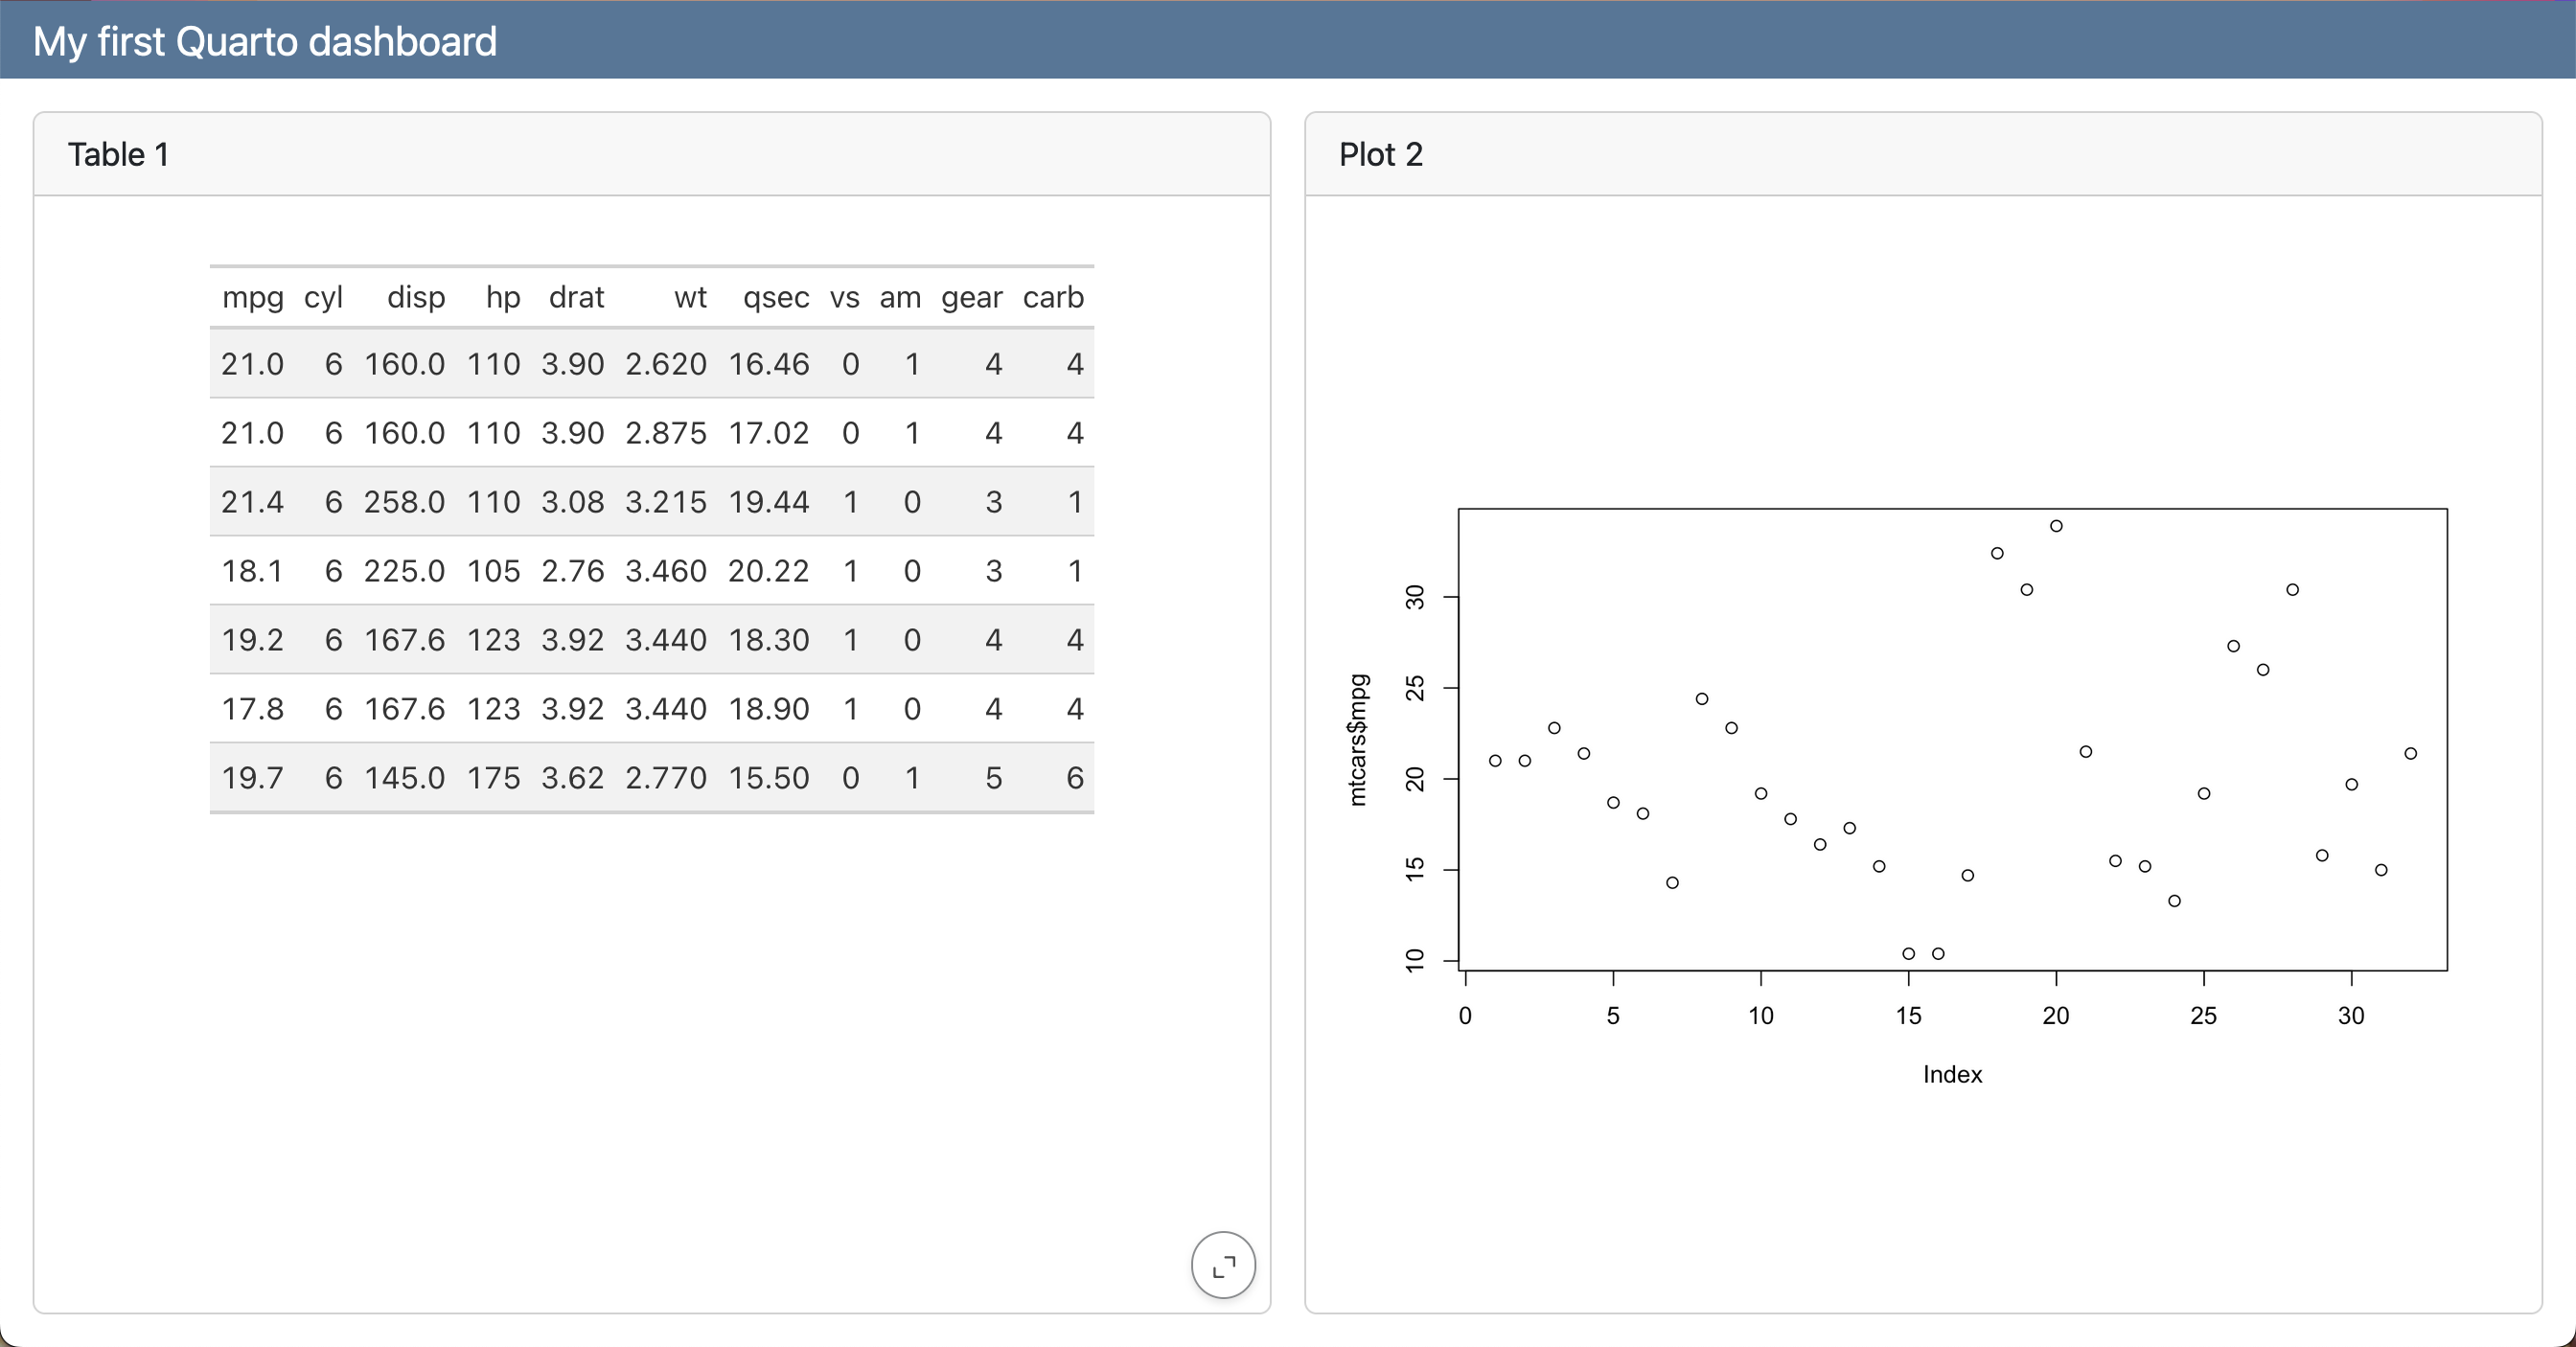
```{r}
#| title: "Plot 2"
plot(mtcars$mpg)
```
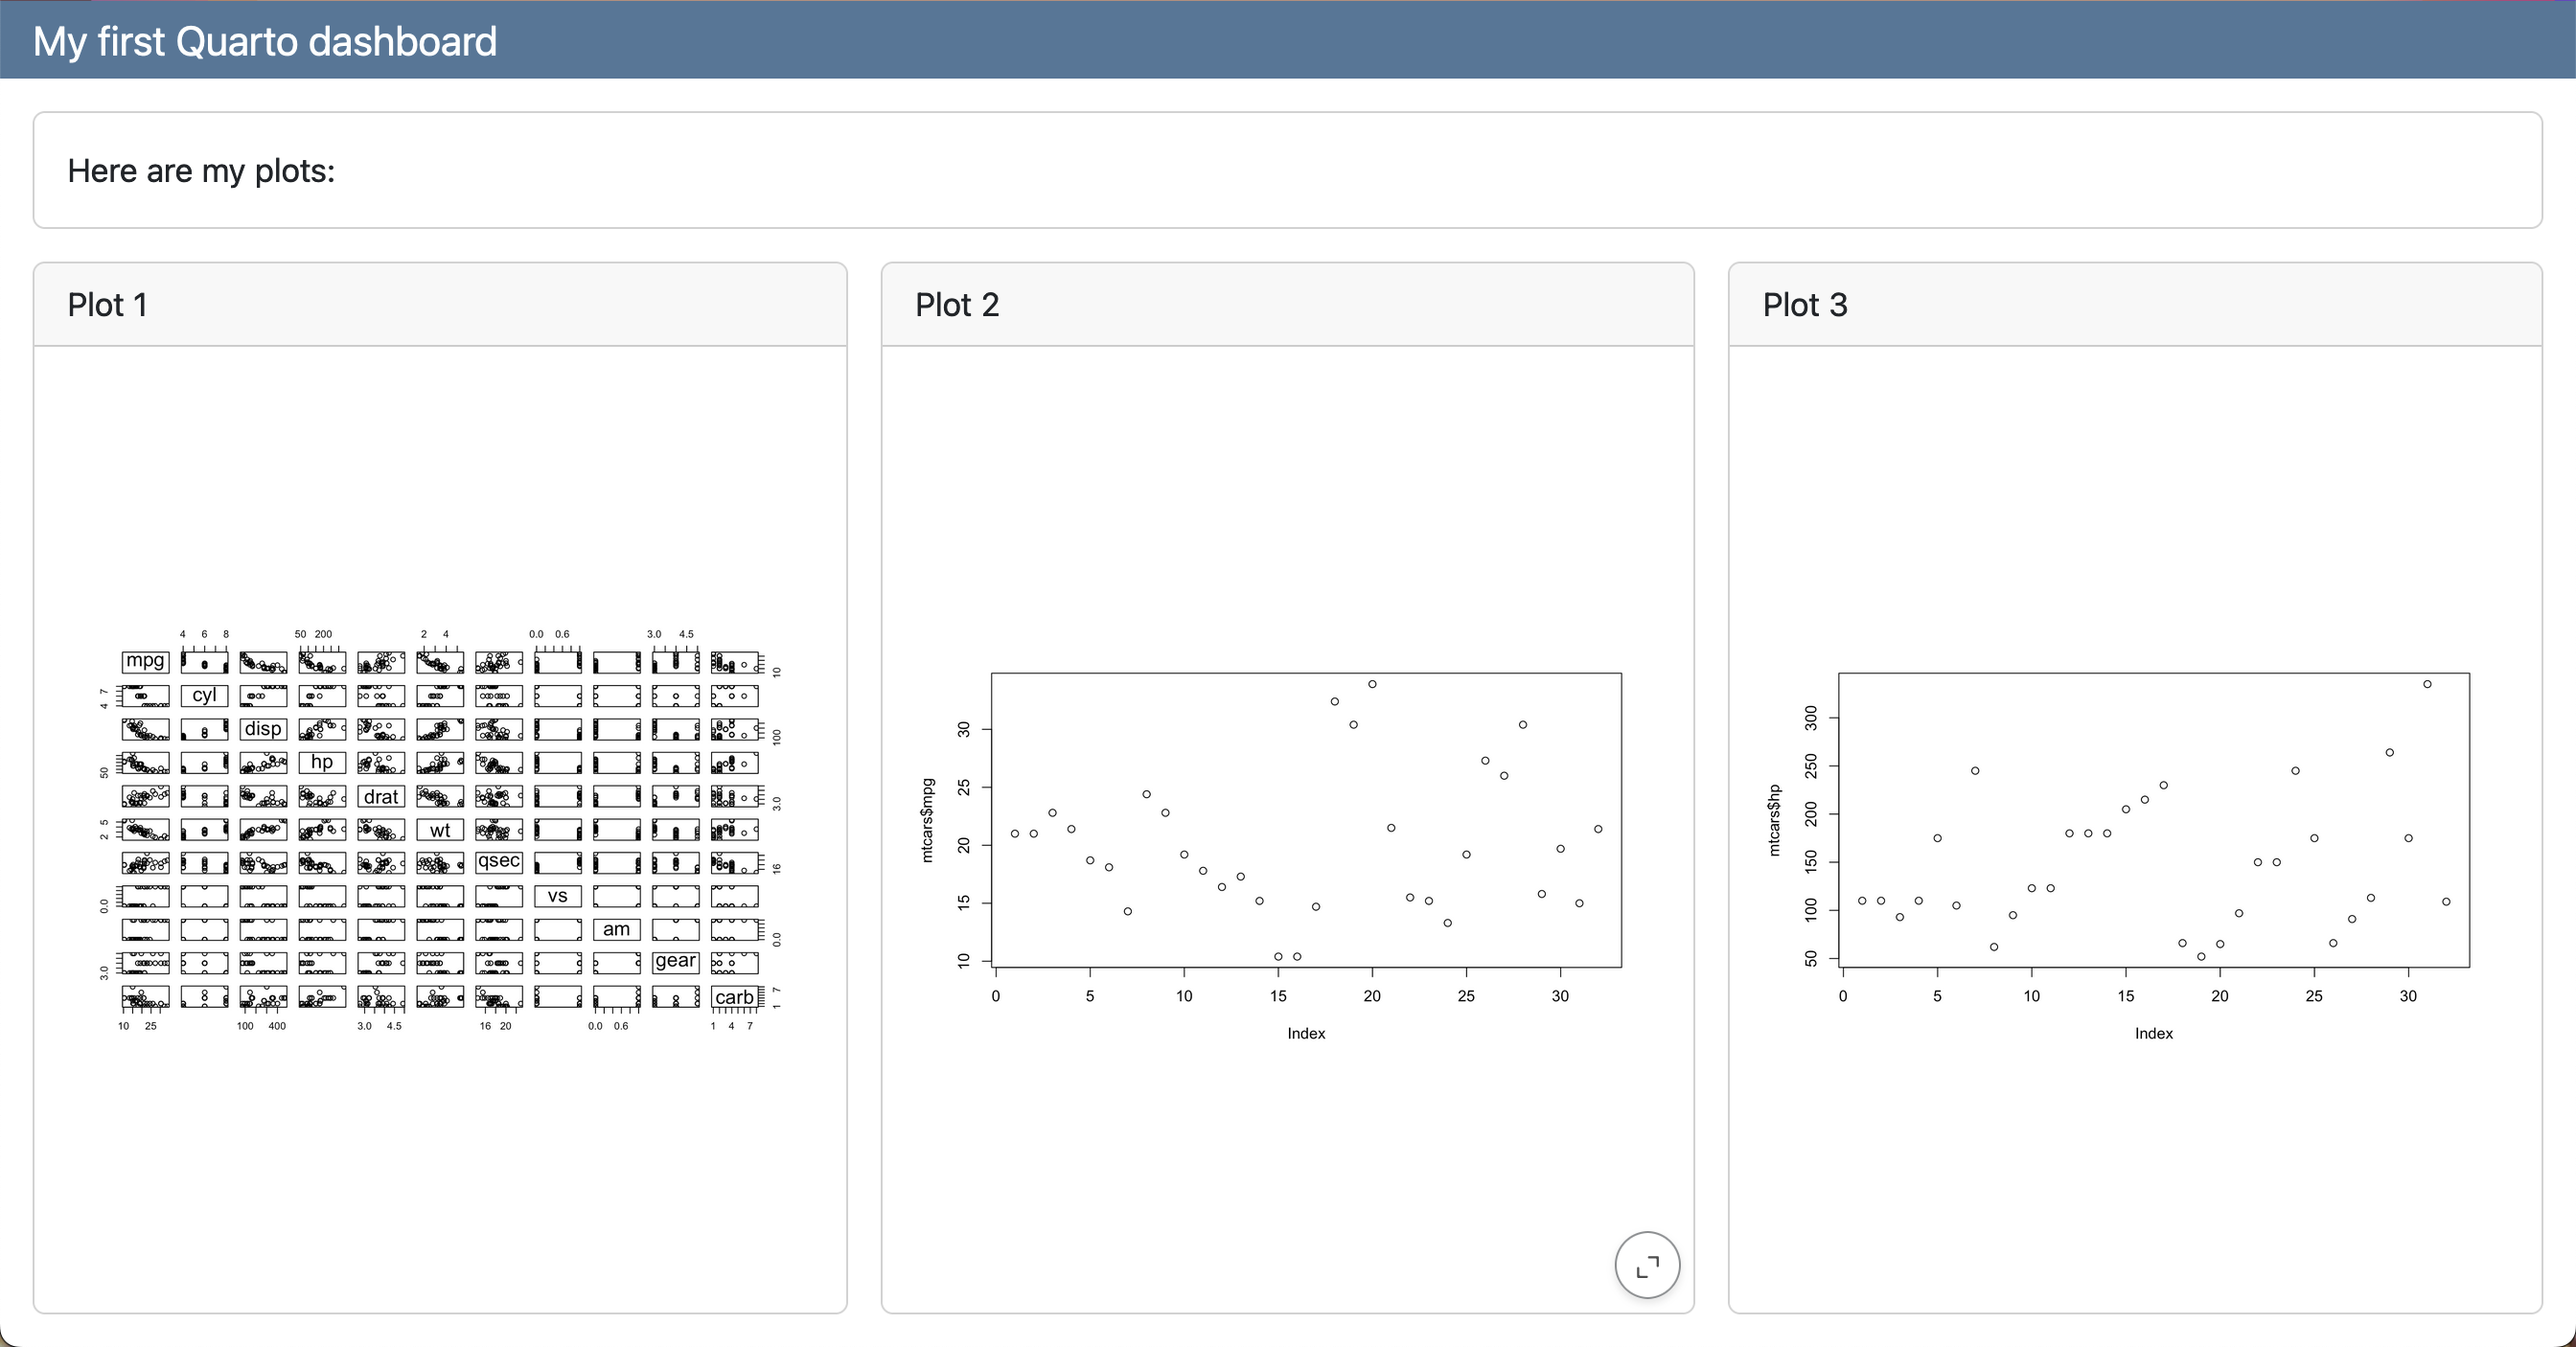
# Page 2
```{r}
#| title: "Plot 3"
plot(mtcars$hp)
```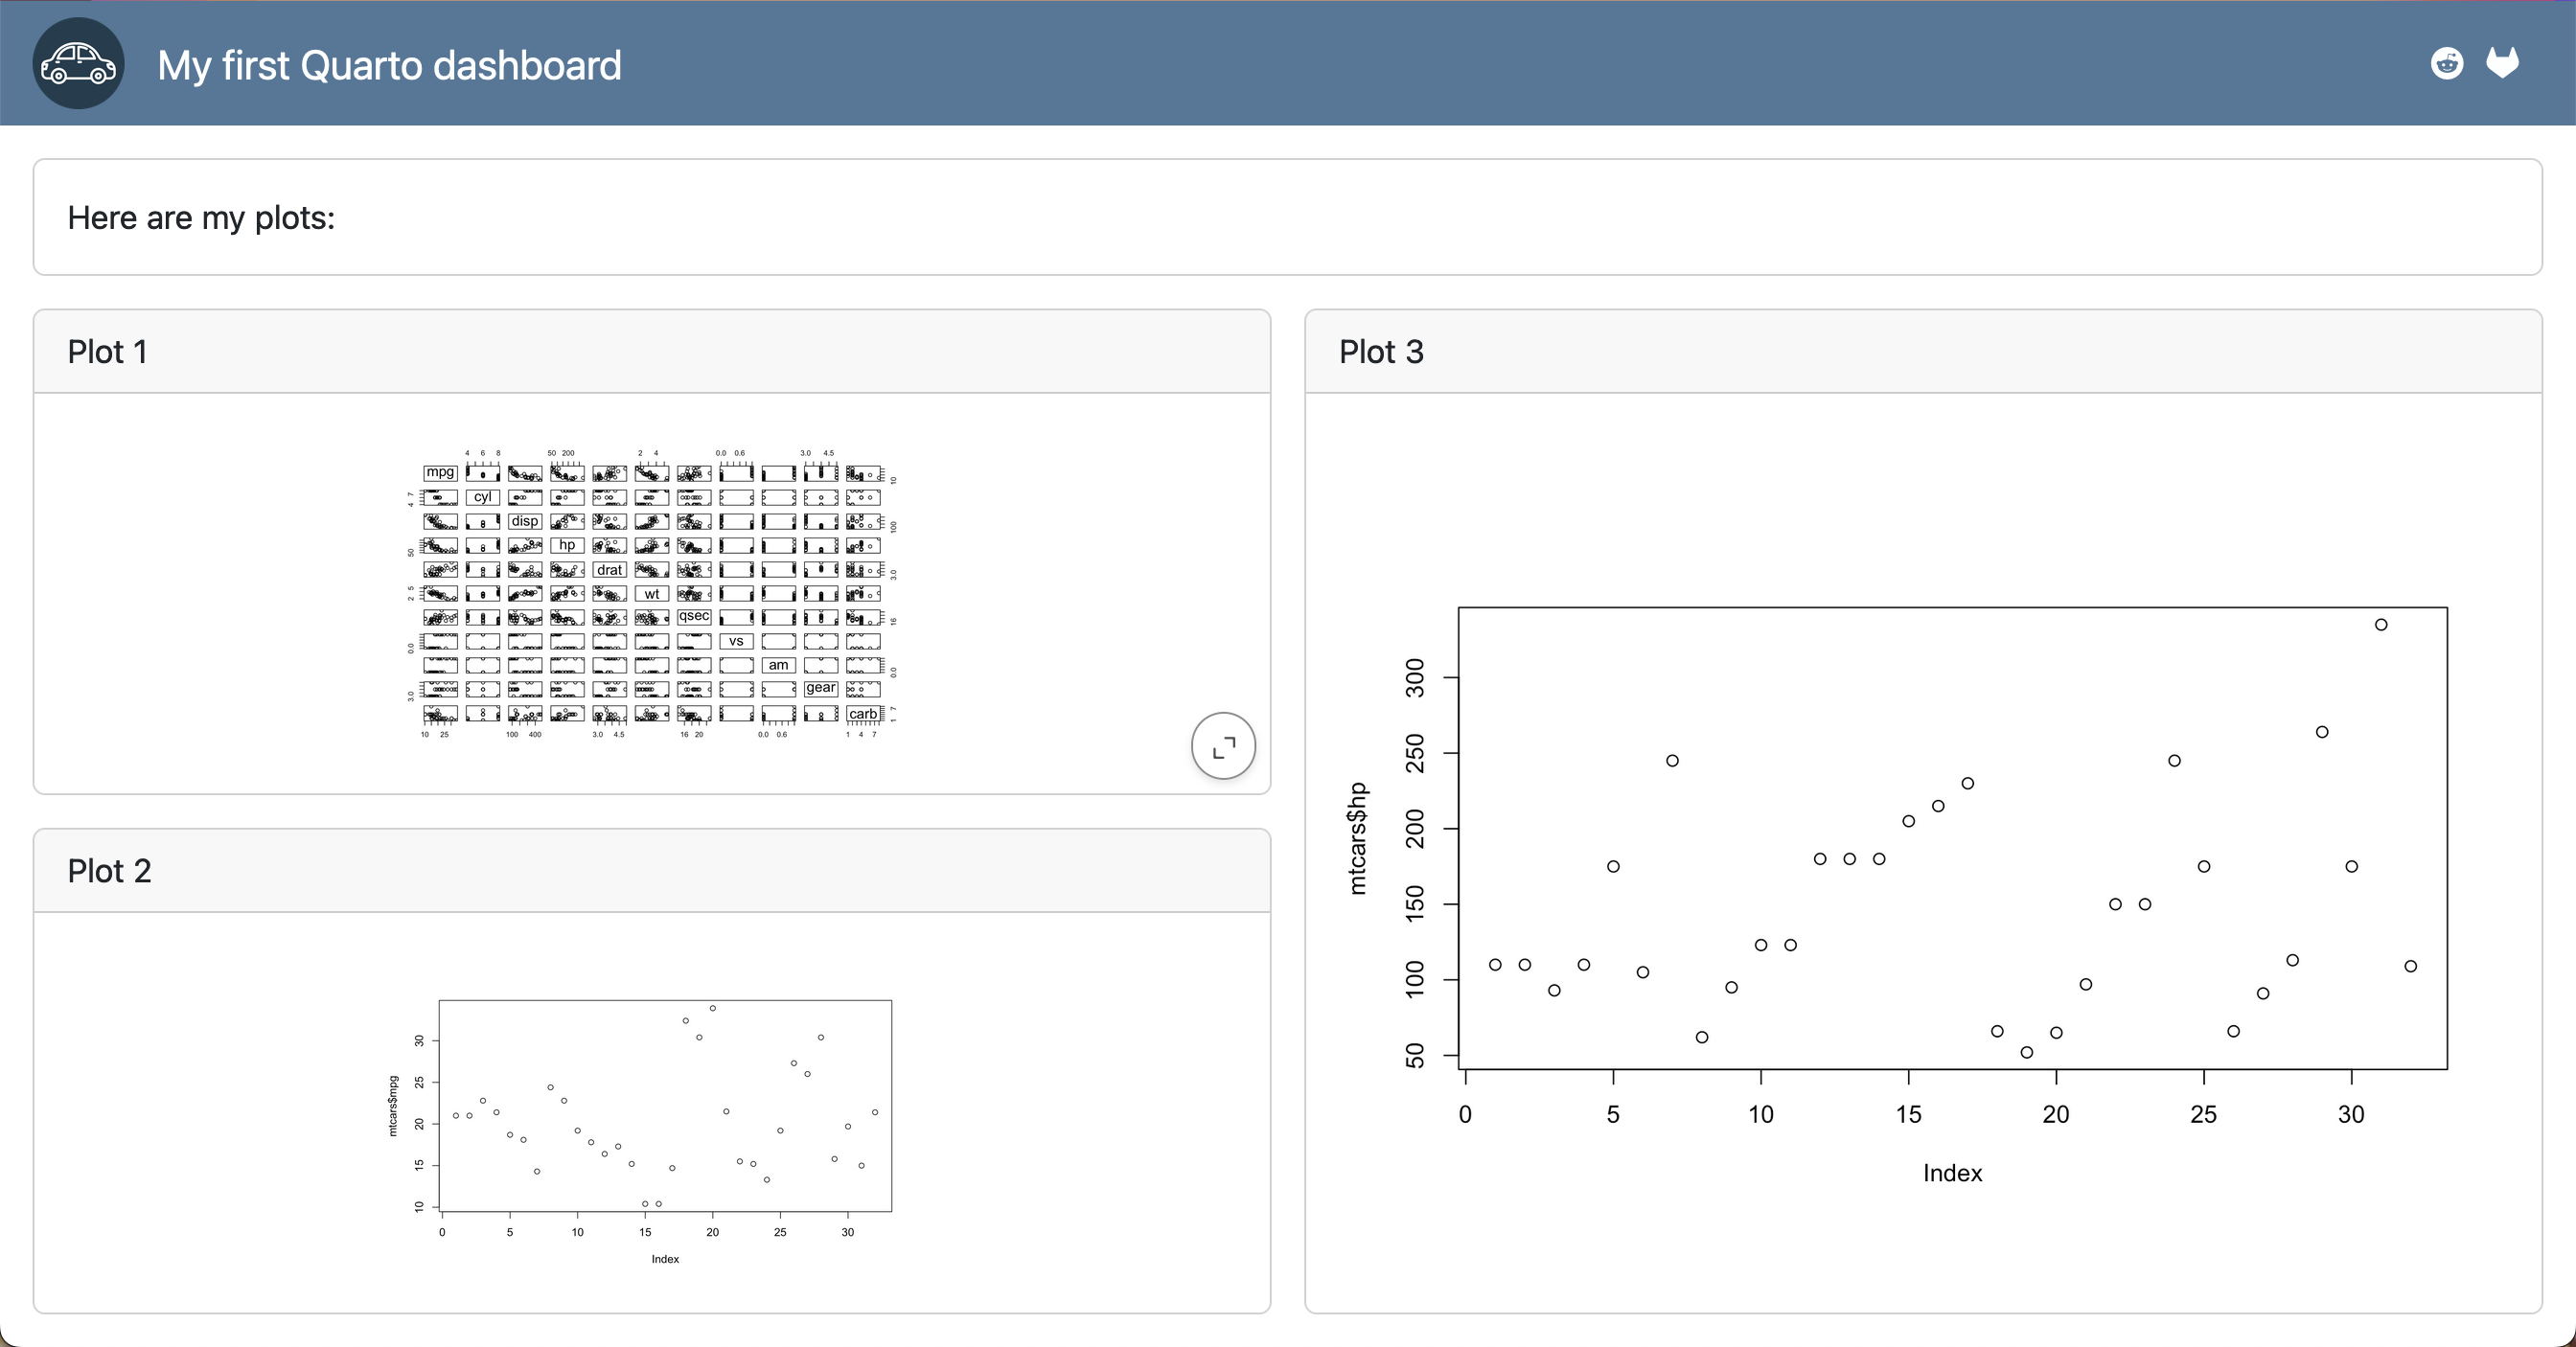
Navigation
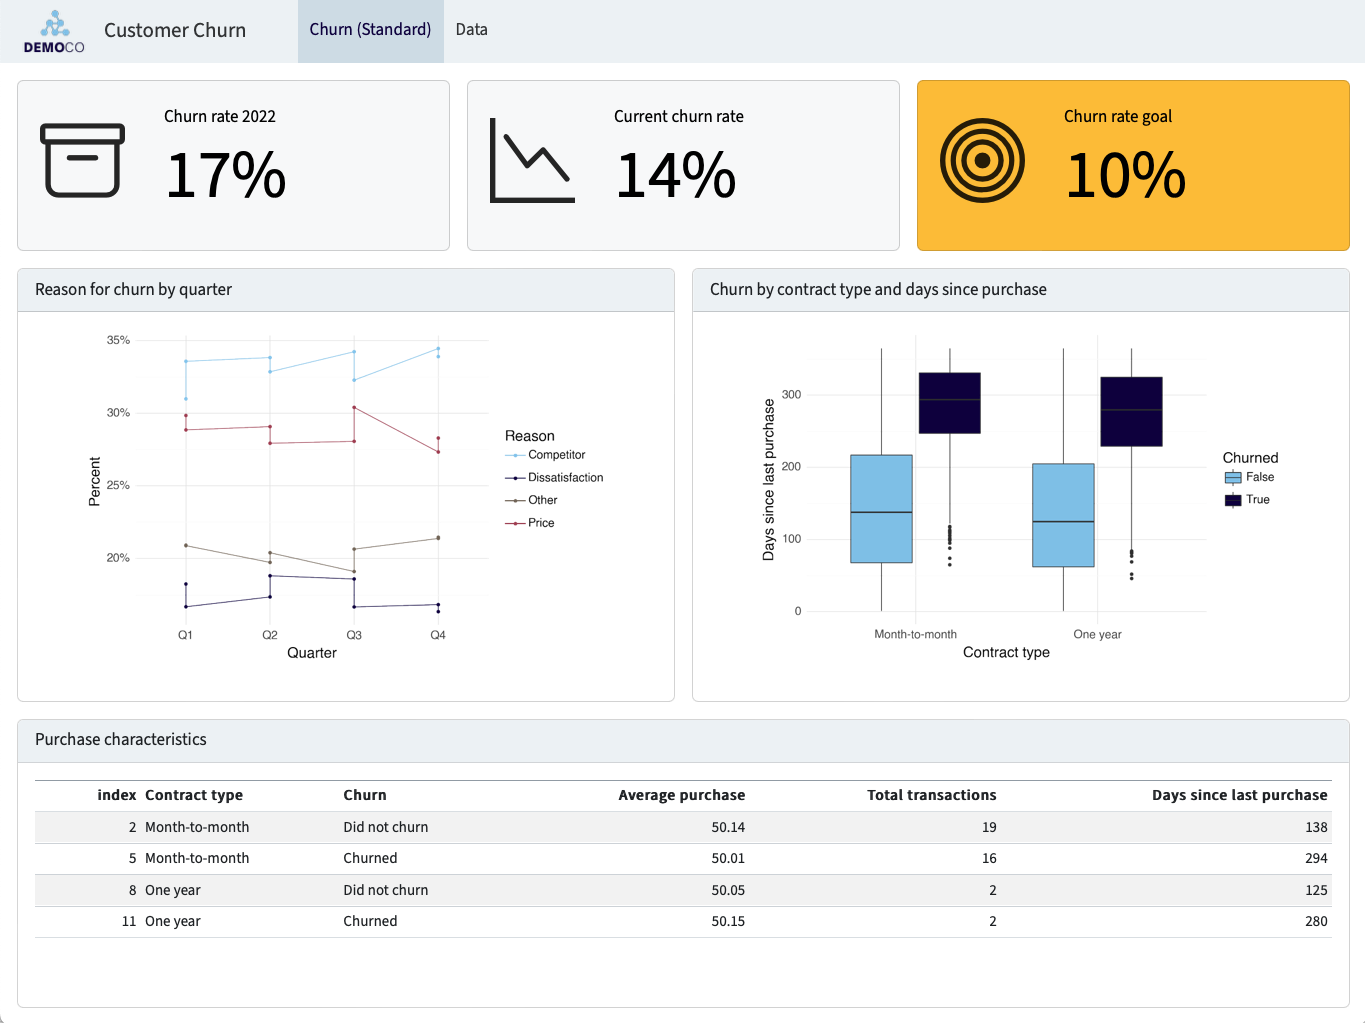
Tables
Produce tabular output within cards:
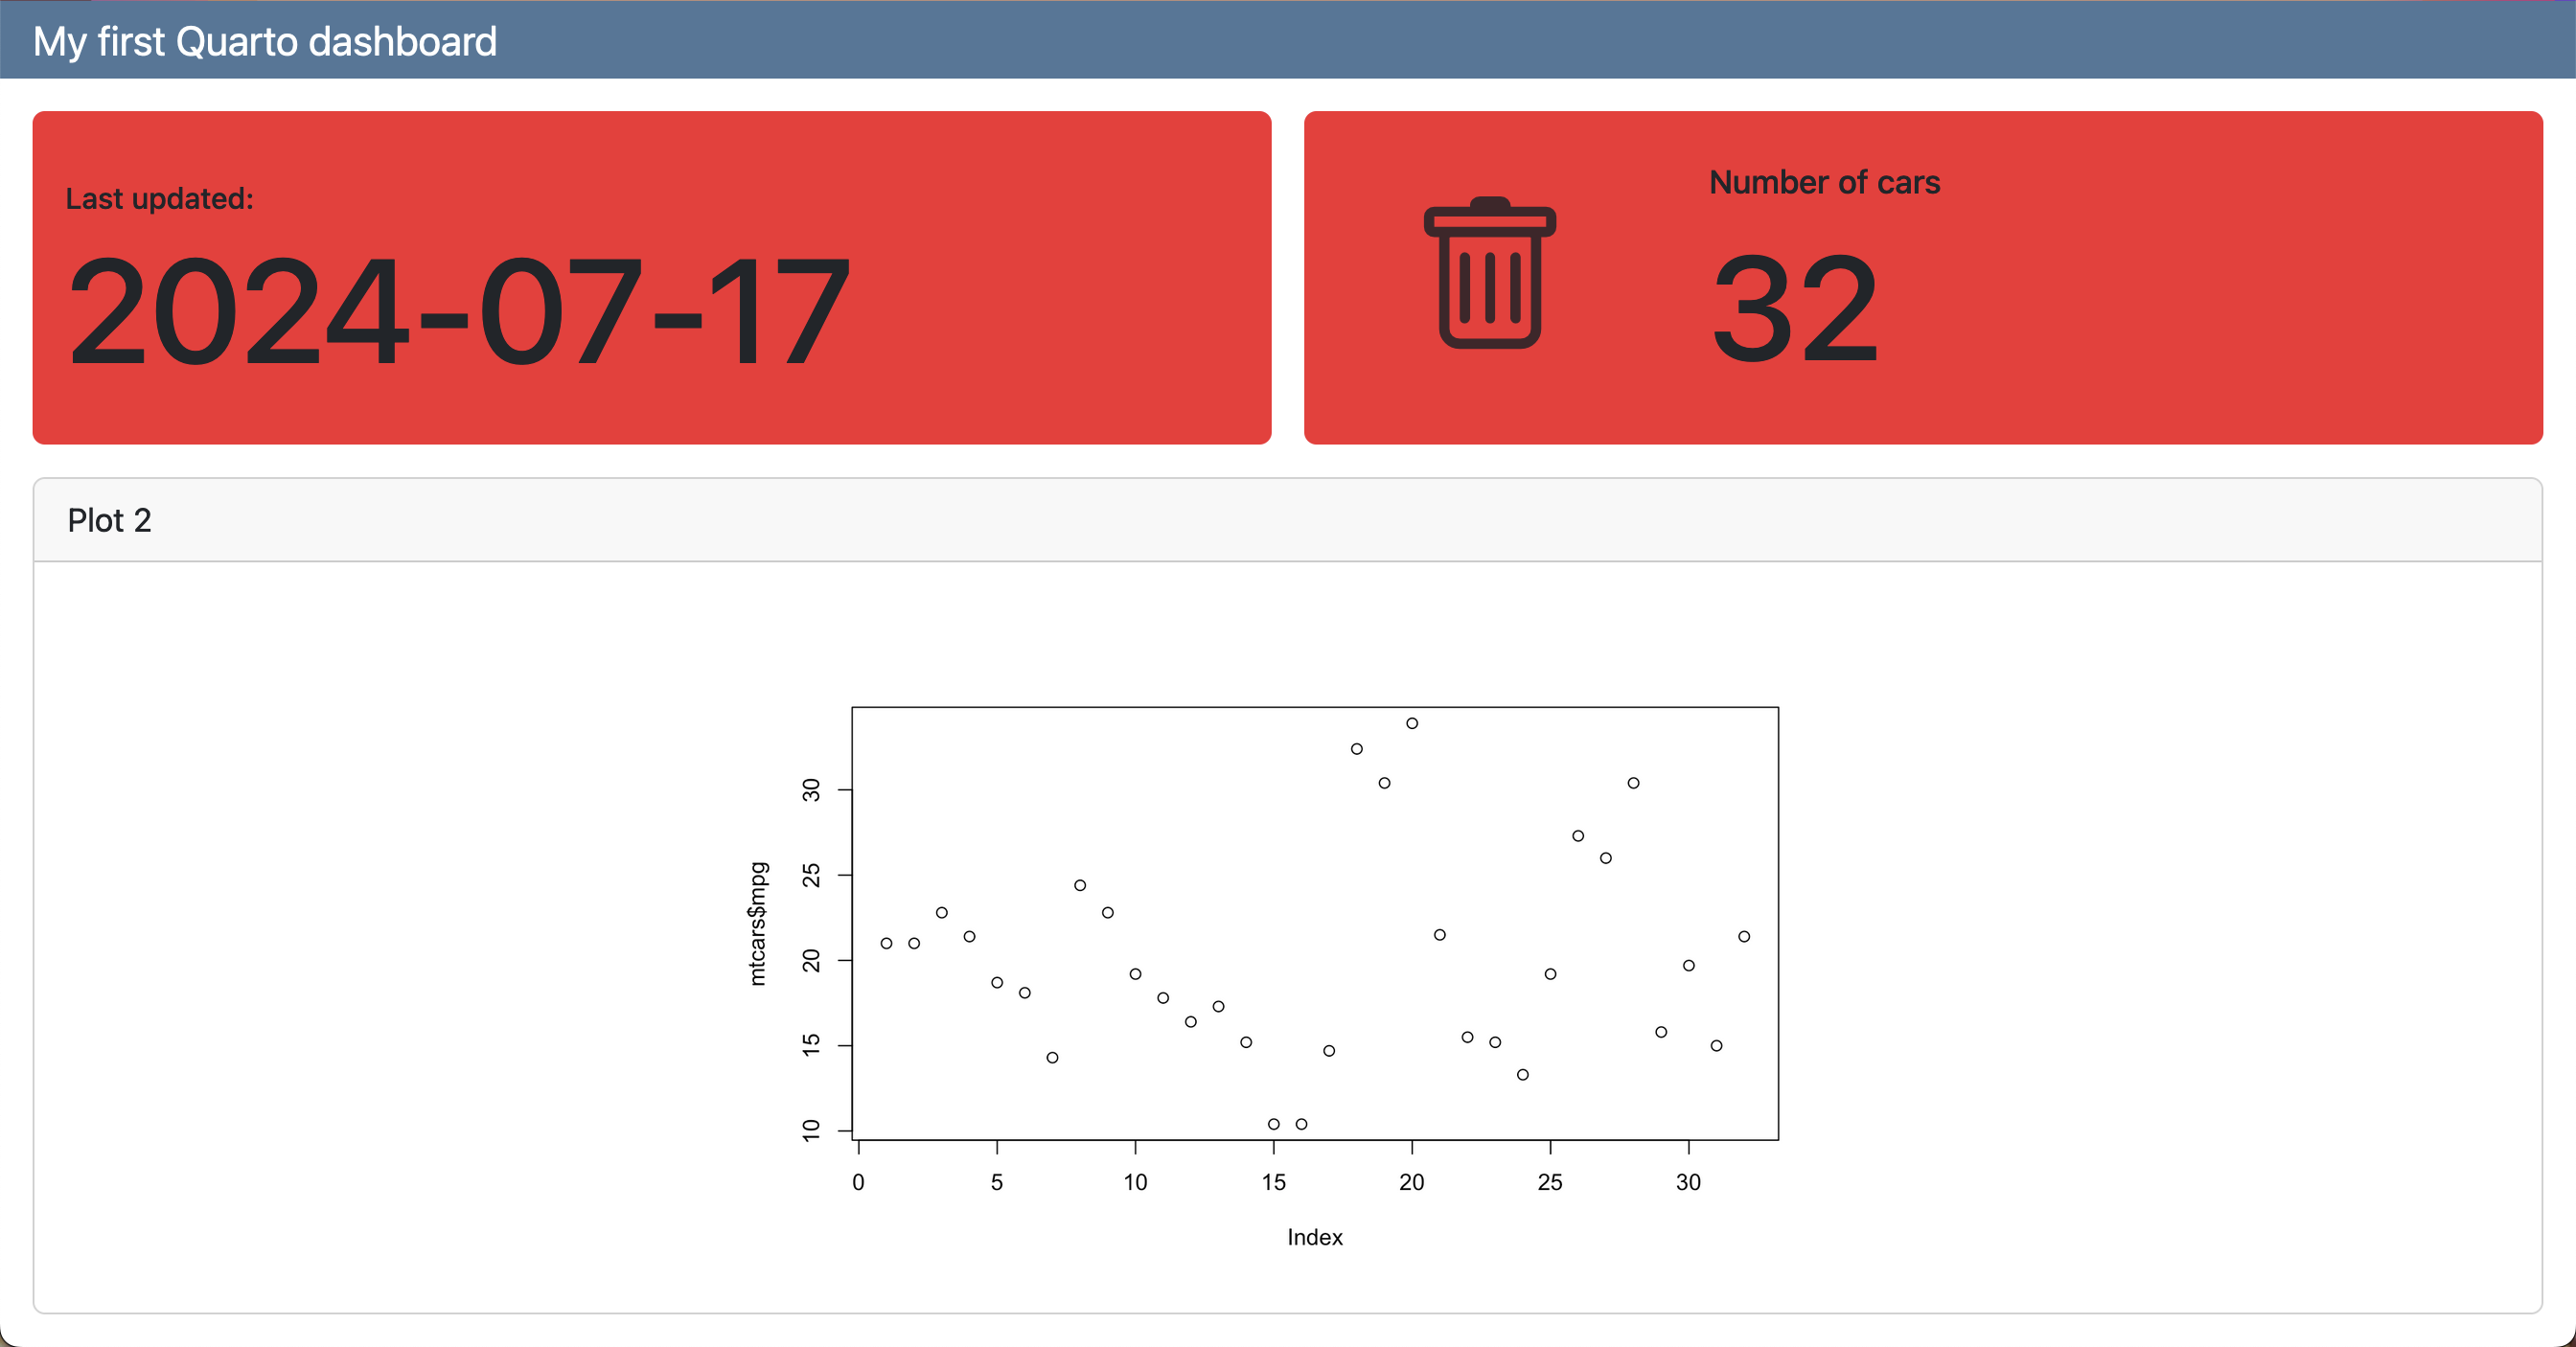
Value Boxes
dashboard.qmd
---
title: "My first Quarto dashboard"
format: dashboard
---
## Row
::: {.valuebox color="#F52A32"}
Last updated:
`{r} Sys.Date()`
:::
```{r}
#| content: valuebox
#| title: "Spam per day"
n <- mtcars |> tibble::as_tibble() |> dplyr::count() |> dplyr::pull(n)
list(
icon = "trash",
color = "#F52A32",
value = n
)
```
## Row
```{r}
#| title: "Plot 2"
plot(mtcars$mpg)
```
Value Boxes
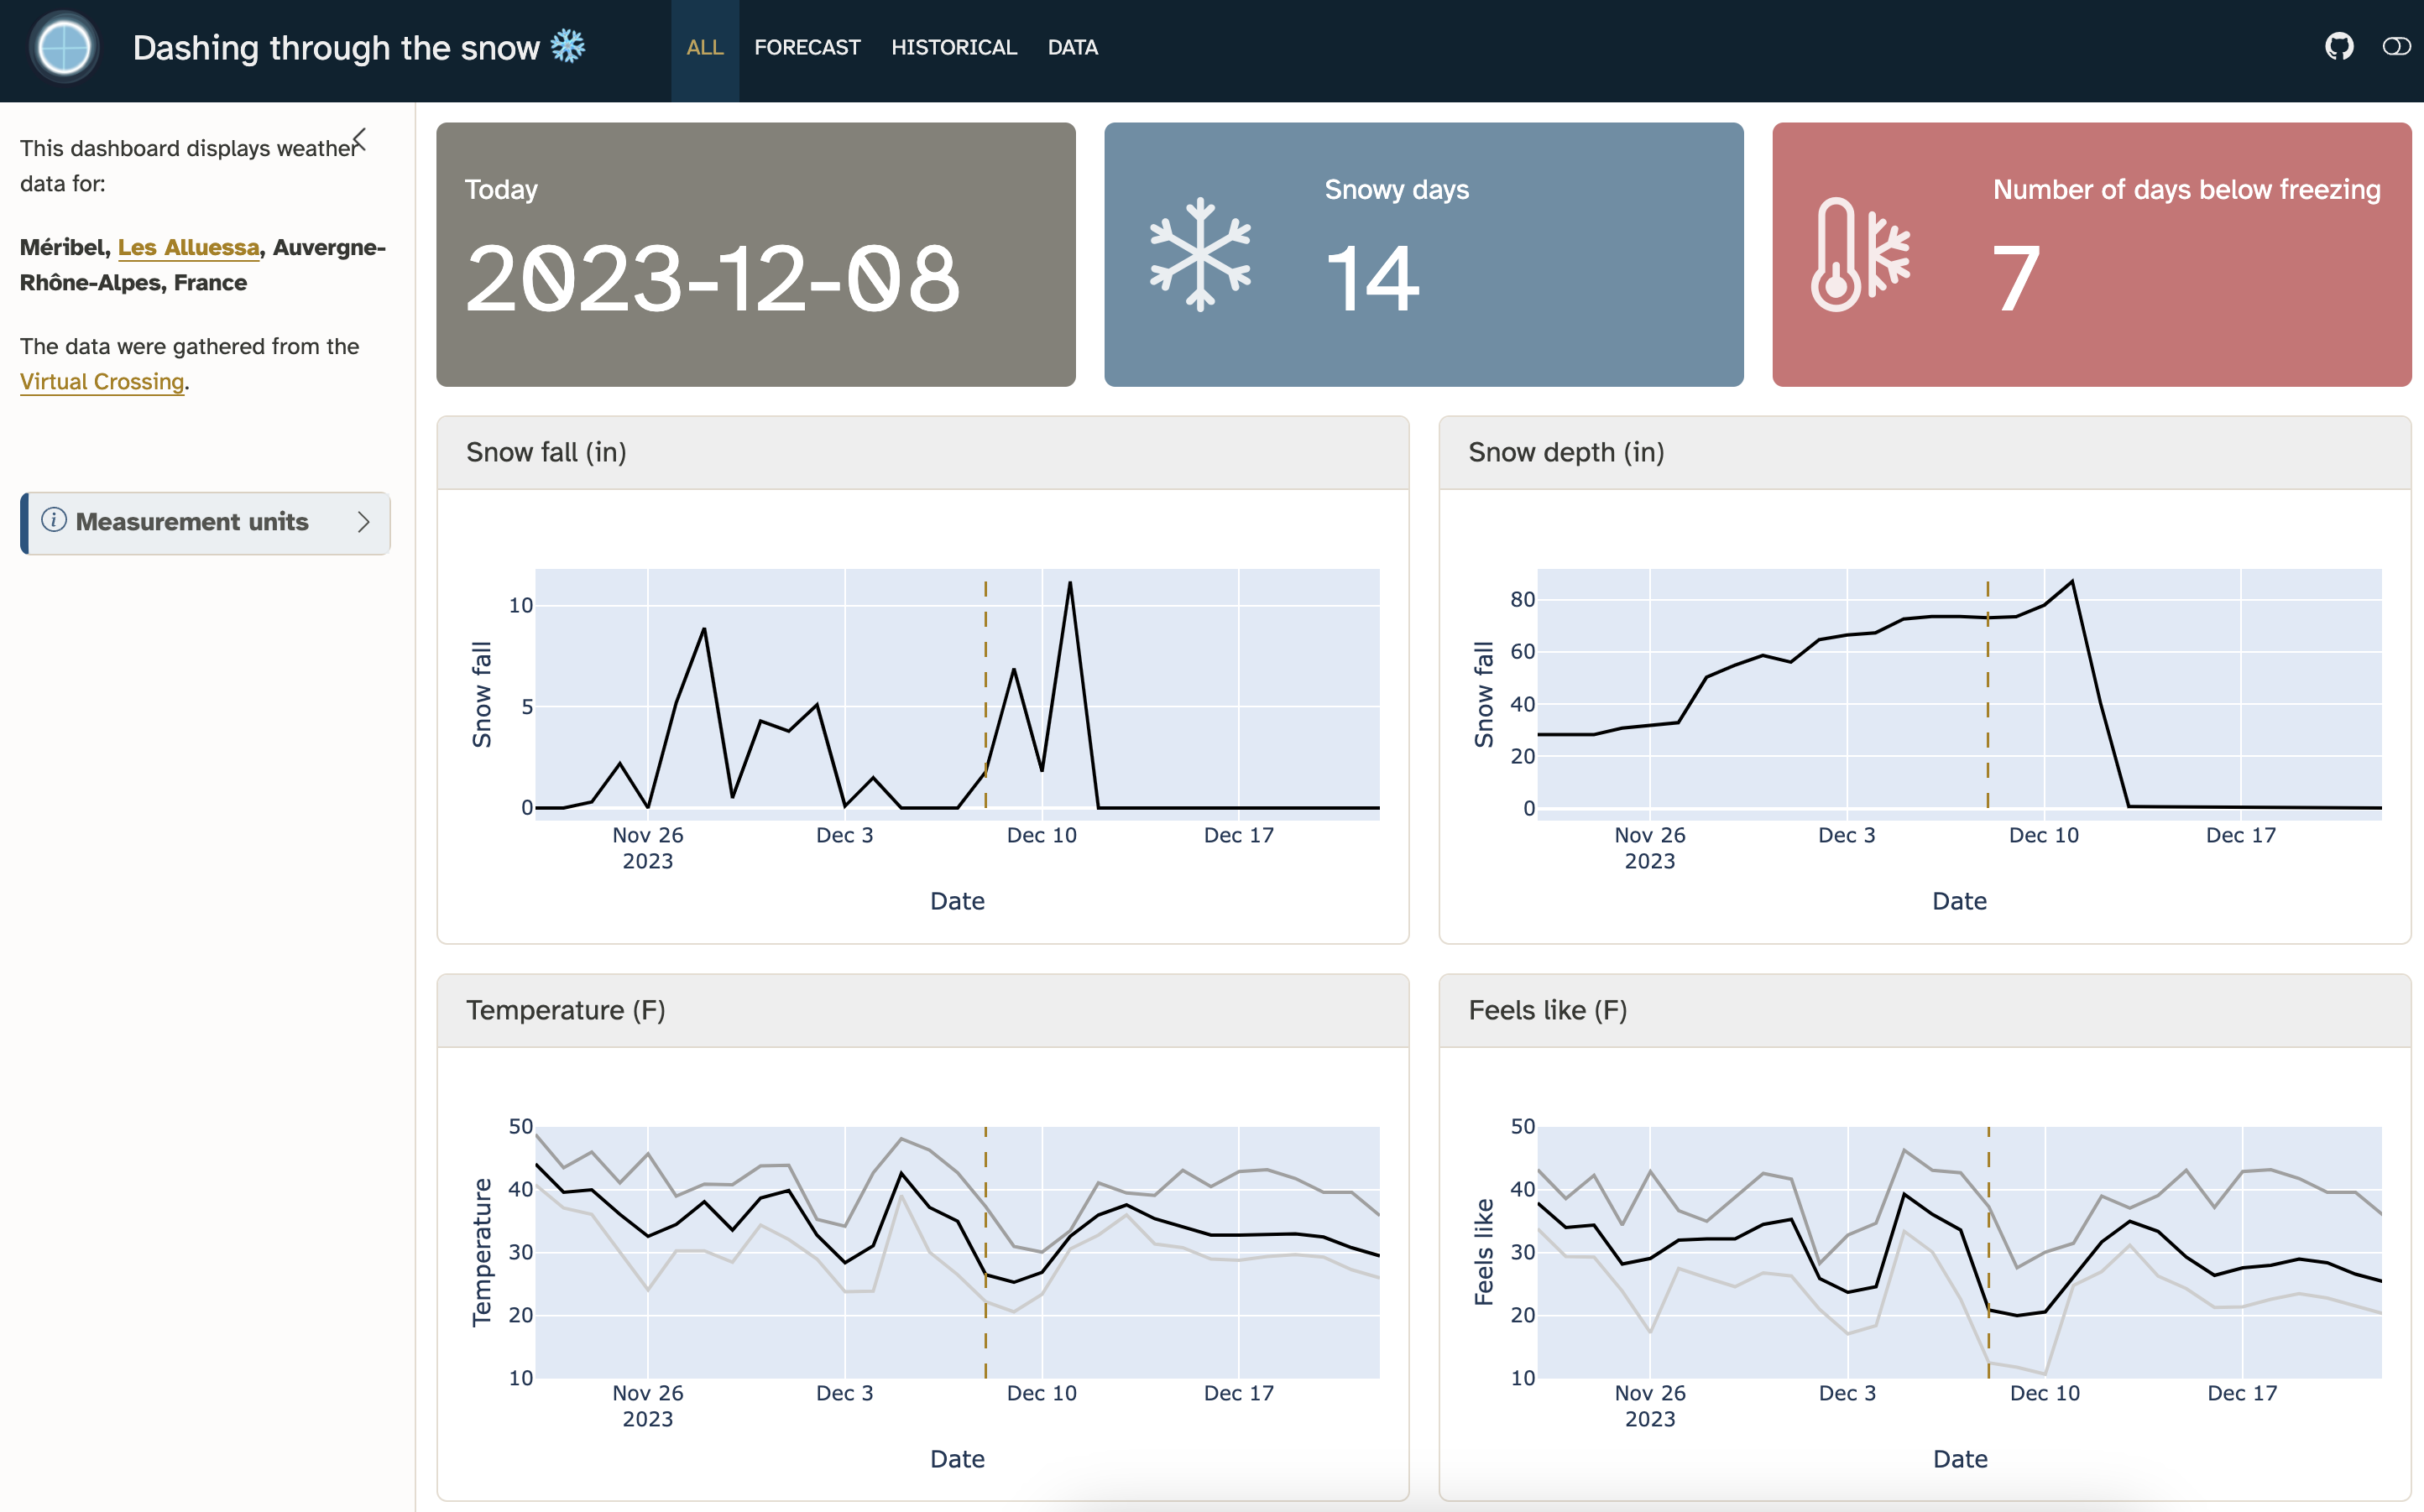
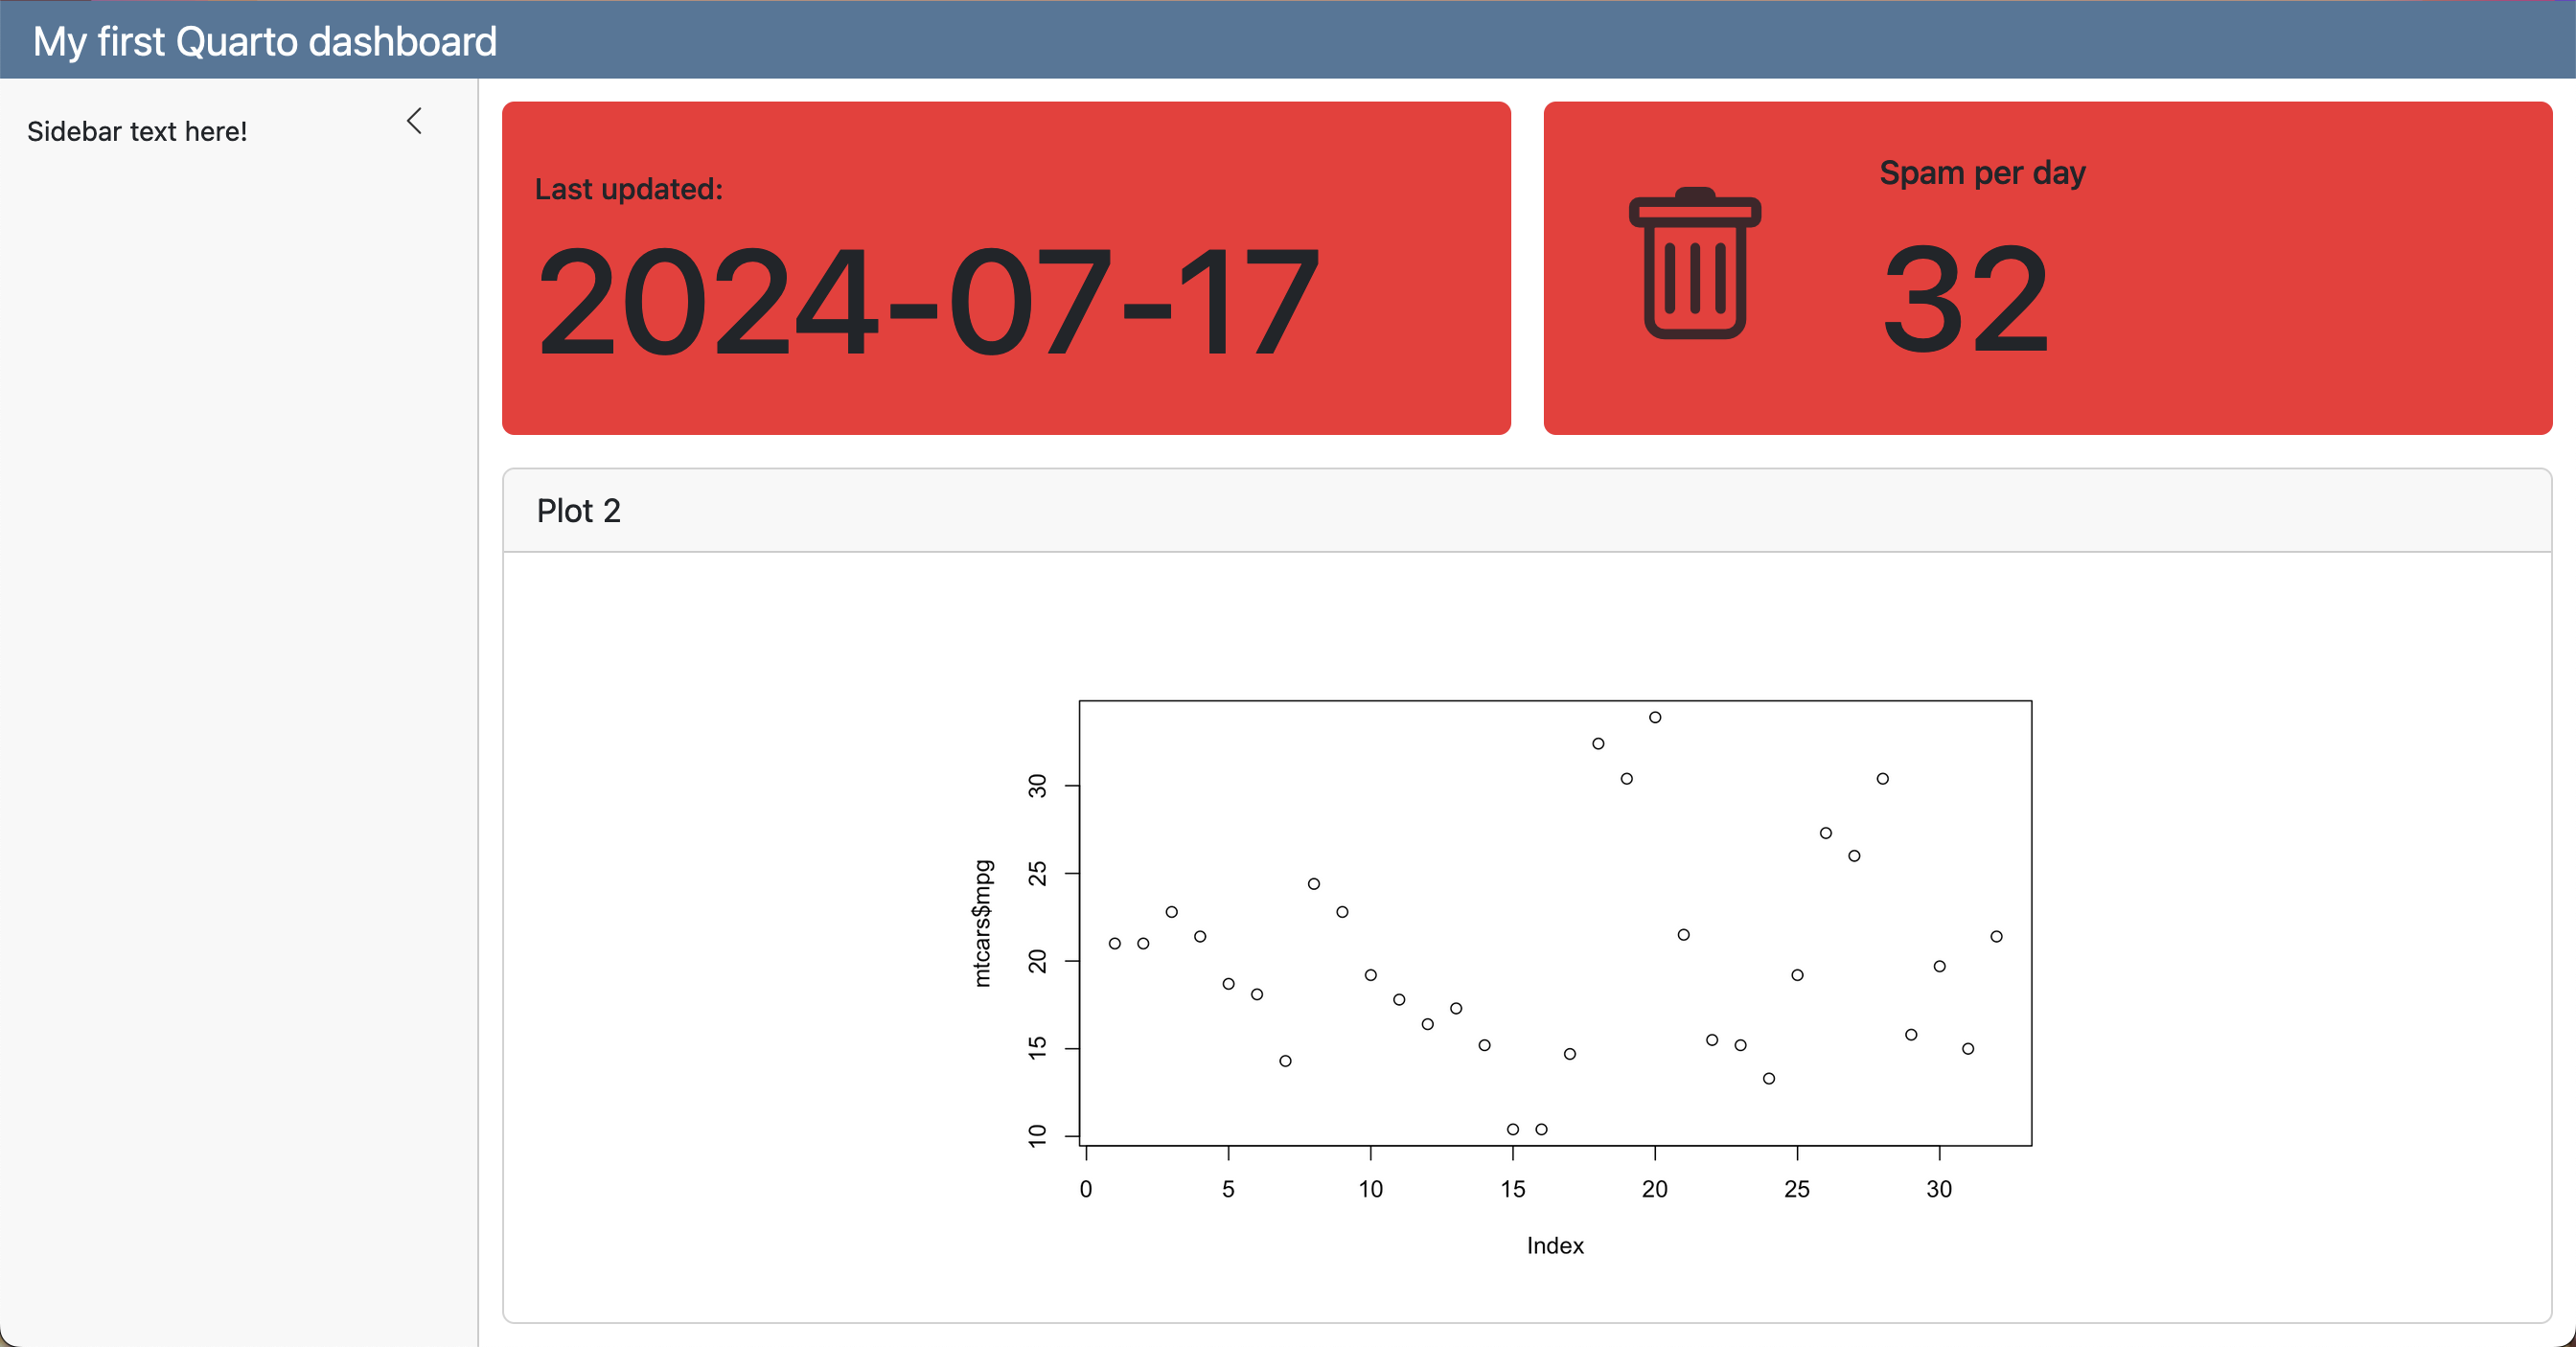
Sidebars
To include a sidebar, add the .sidebar class to a Level 2 heading:
dashboard.qmd
---
title: "My first Quarto dashboard"
format: dashboard
---

## {.sidebar}

Sidebar text here!

## Column

### Row

::: {.valuebox color="#F52A32"}
Last updated:

`` `{r} Sys.Date()` ``
:::

```{r}
#| content: valuebox
#| title: "Spam per day"
n <- mtcars |> tibble::as_tibble() |> dplyr::count() |> dplyr::pull(n)

list(
  icon = "trash",
  color = "#F52A32",
  value = n
)
```

### Row

```{r}
#| title: "Plot 2"
plot(mtcars$mpg)
```
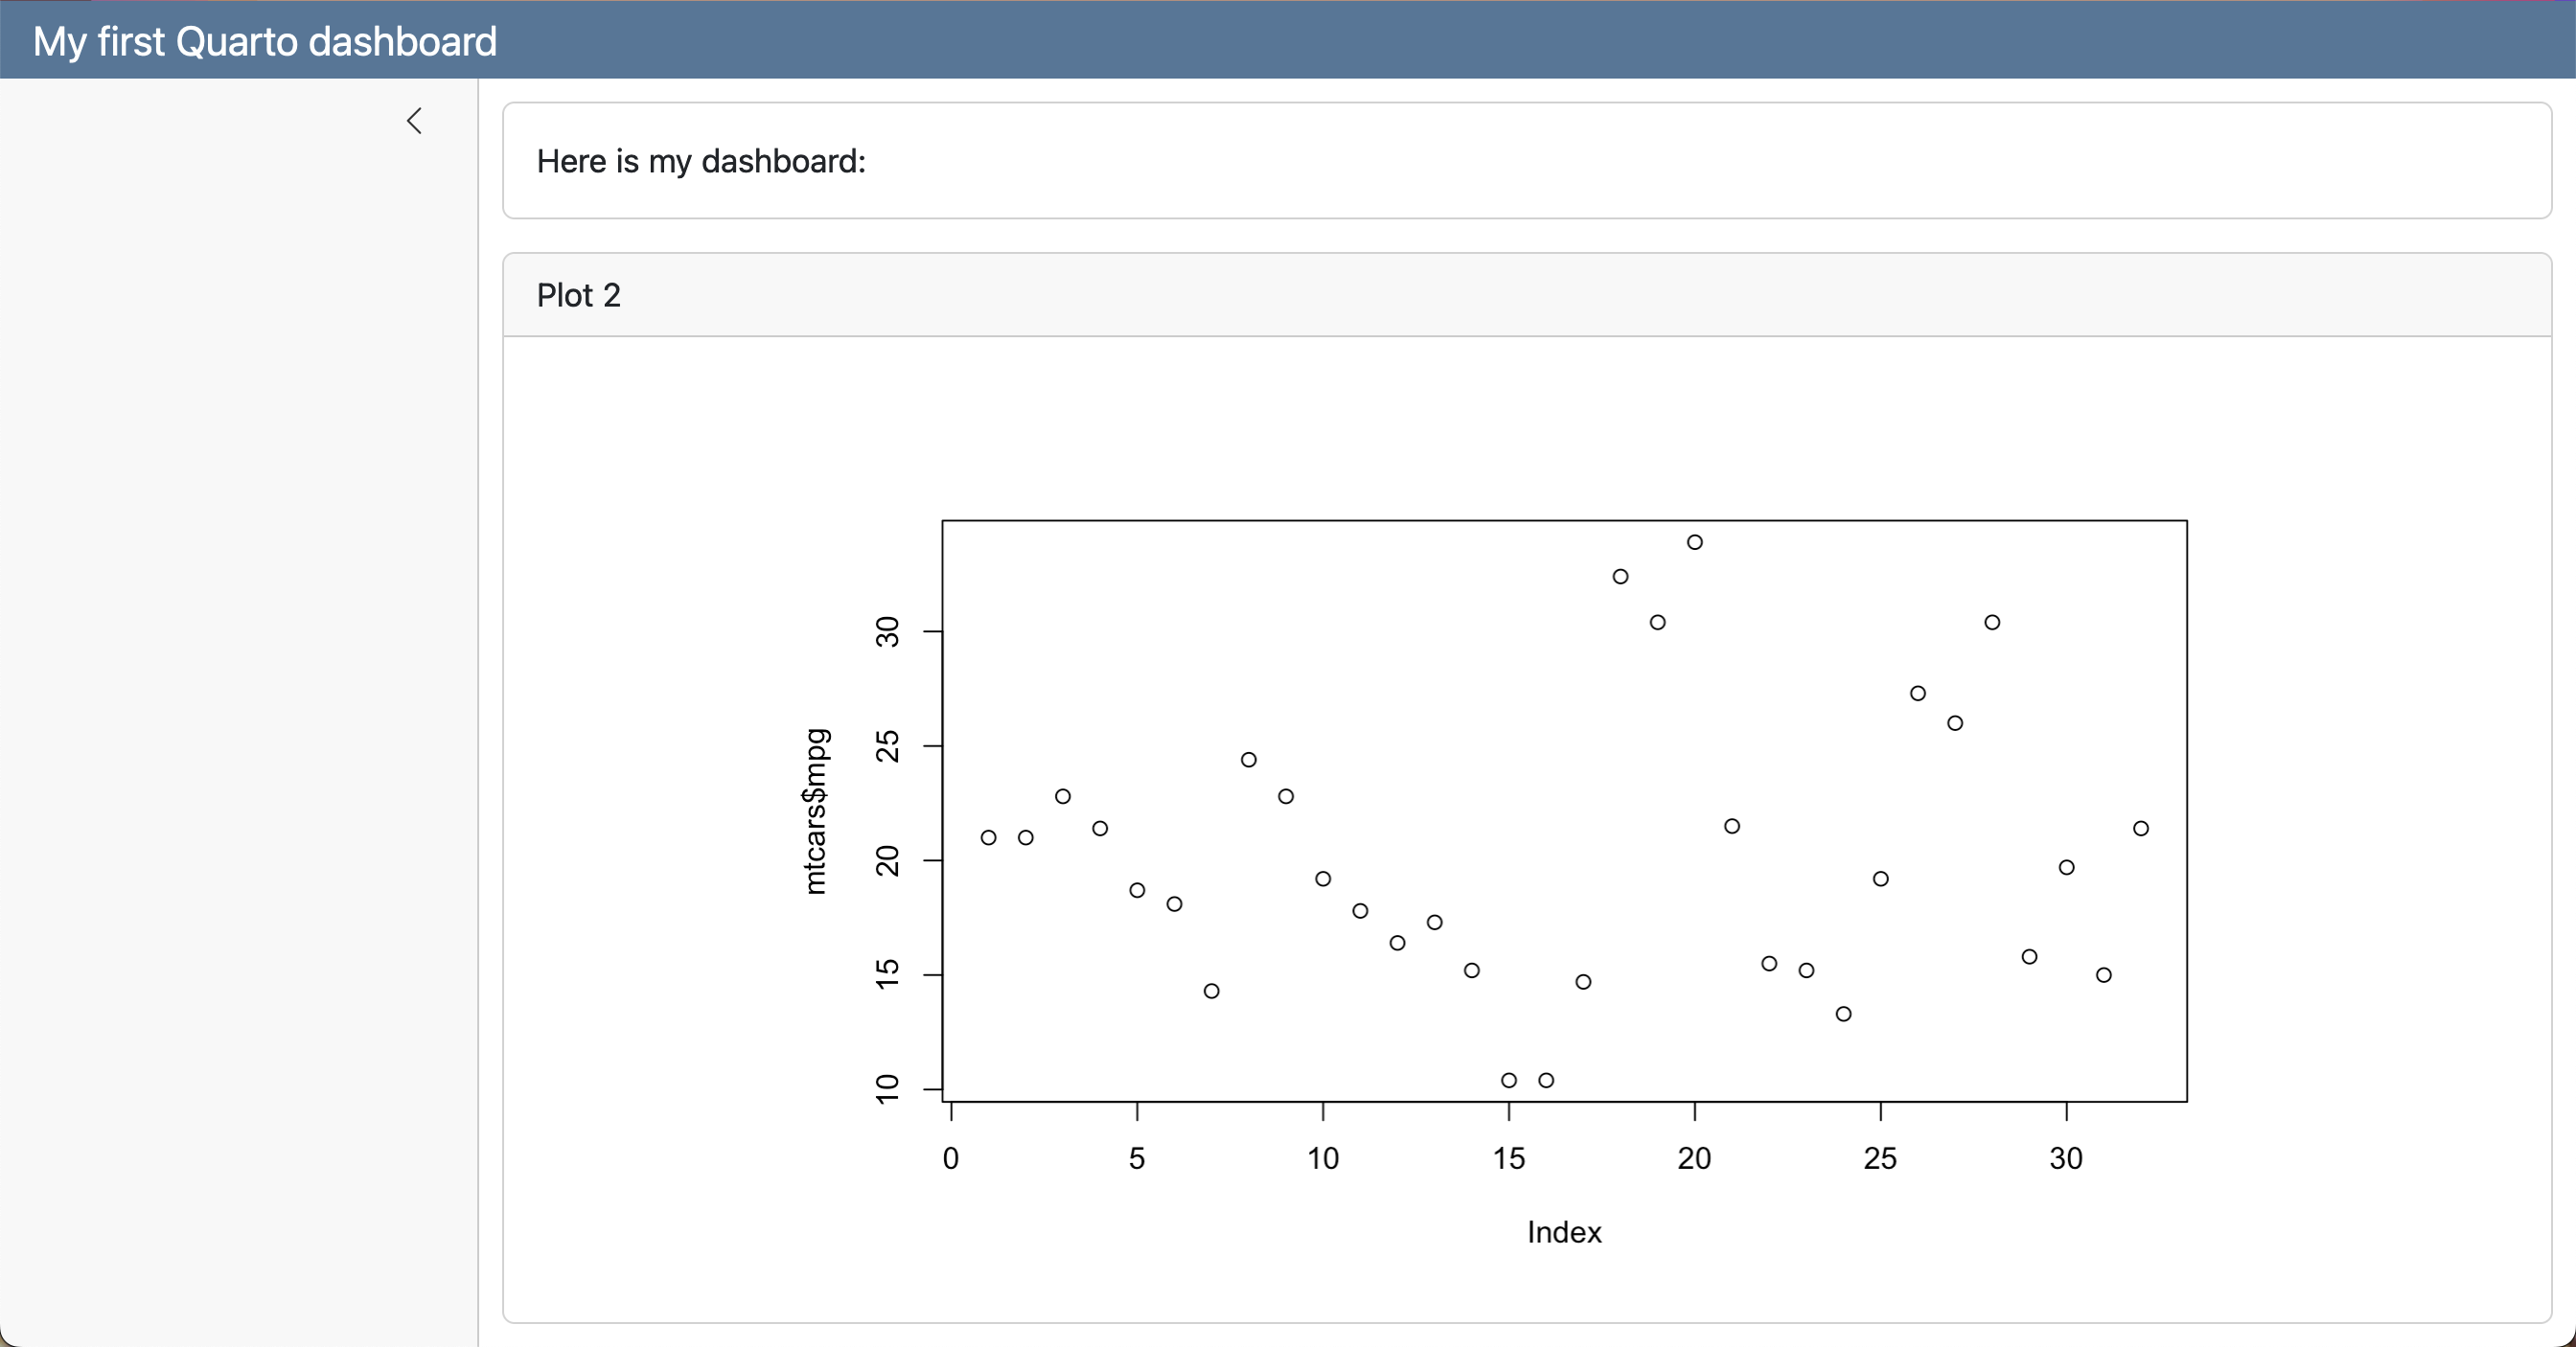
Non-interactive dashboard
Add Interactive Components
dashboard.qmd
---
title: "My first Quarto dashboard"
format:
  dashboard:
    orientation: rows
server: shiny
---

```{r}
#| context: setup
library(ggplot2)
```

## {.sidebar}

```{r}
selectInput(
    "variableChoice",
    "Choose a variable:",
    choices = names(mtcars)
  )
```

## Column

### Row

Here is my dashboard:

### Row

```{r}
#| title: "Plot 2"
plotOutput("variablePlot")
```

```{r}
#| context: server

output$variablePlot <- renderPlot({
  yVar <- mtcars[[input$variableChoice]]
  plot(mtcars$index, yVar)
})
```
Add Interactive Components